Ever since the Coronavirus pandemic negatively affected ad rates, many publishers have worked hard to keep growing their websites and weather the storm. Ad rates have since improved. They are actually at a higher level currently than they were at the same time last year (June/July 2019).
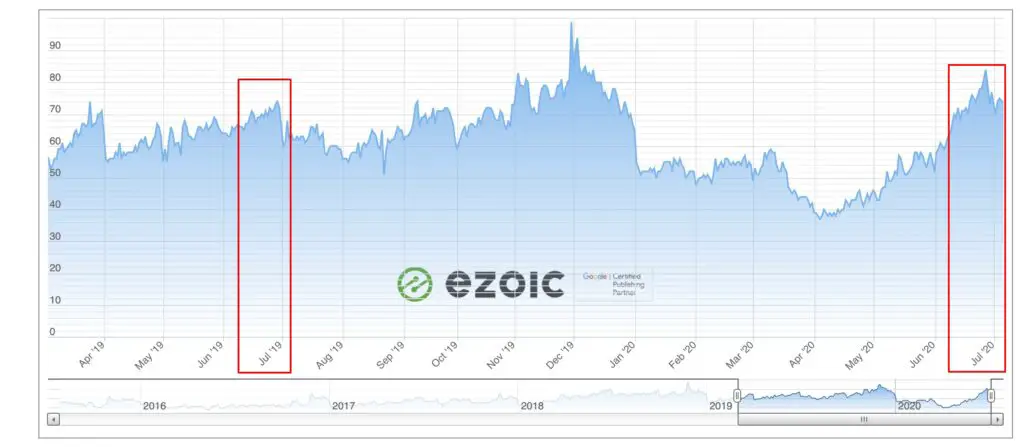
Now that the momentum of ad rates is building, it’s a good idea to not take your foot off the gas pedal of your website’s growth. Publishers who use Ezoic’s Big Data Analytics have the upper hand when it comes to understanding all aspects of their website and how they relate to revenue and visitor engagement.
Today, I’m going to show you the 5 reports within Big Data Analytics that you need to grow your site. Additionally, in each section, I will include a link that will take Ezoic publishers that are logged in to the Ezoic Dashboard directly to the specified report.
1. Content Categories
First and foremost is the Content Categories report. For publishers who want to effectively scale their content production, this report is bar-none.
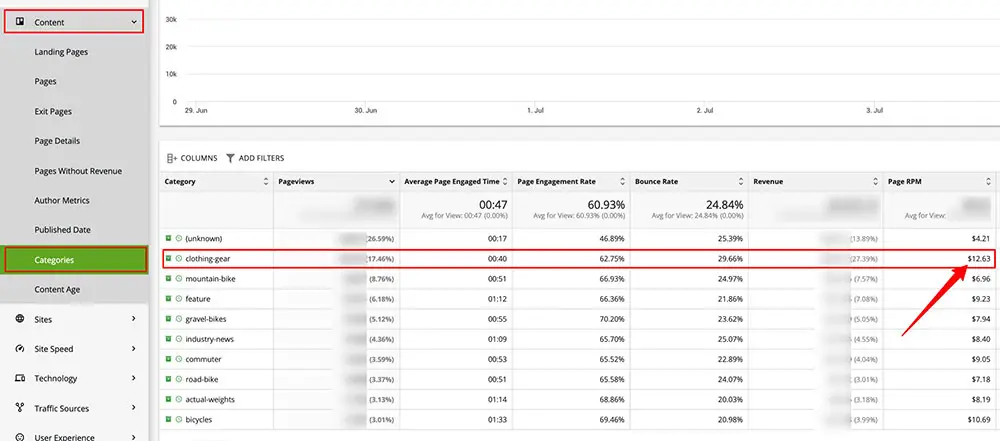
For example: This publisher in the biking niche has their website’s content categories set up properly. We can see that the “clothing/gear” category has the highest page RPM by a margin of nearly 2 dollars higher compared to the second-highest-earning category. This gives the publisher insight that they might want to produce more content around clothing and gear, since even though it only represents 17.46% of the total content, it accounts for 27.39% of their website’s total revenue. In theory, if they produce more content within that category, they will earn more revenue.
Additionally, we wrote an article on how to set up your website’s categories properly. Because if you don’t have categories in your Content Management System set up for each of your articles, the only category that will show up is the default “unknown” category.
For Ezoic publishers, here is the link to the Content Categories Big Data Analytics report. What’s more, is that you can save custom reports that will keep your custom segments and column structures, and this applies to all the reports in sections below as well. You also have the ability to export the data to Excel and CSV.
2. Landing Pages
The landing pages report in Big Data Analytics is the go-to place to see the metrics of your website’s top-performing content. By default, the landing page URLs are listed by the number of visits ordered from highest to lowest.
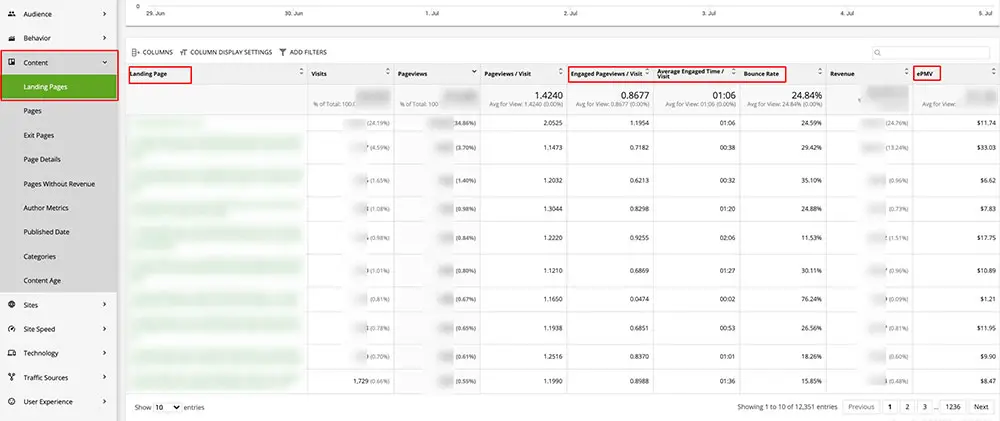
This report gives you foundational knowledge about the value of certain landing pages. Some of the most important metrics on this report are EPMV, and engagement metrics like Engaged Pageviews per visit, Average Engaged Time per visit, and bounce rate.
Knowing which of your pages are the most valuable to advertisers is important when it comes to doing direct deals, trying to decide which pages to put affiliate links on, and more.
Additionally, if you track these metrics regularly and you saw one of your most profitable pages disappear from this report, that may be a sign to double-check your ad setup and make sure that ads are displaying on that page.
For Ezoic publishers, here is the link to the Landing Pages report in Big Data Analytics.
3. Page Details
The Page Details report in Ezoic’s Big Data Analytics is invaluable for content production. This report gives publishers granular details on all your website’s articles, and the data is ordered by article length.
When you have your website’s articles ordered by content length ranges, you can see which content length is the most valuable and receives the highest user engagement.
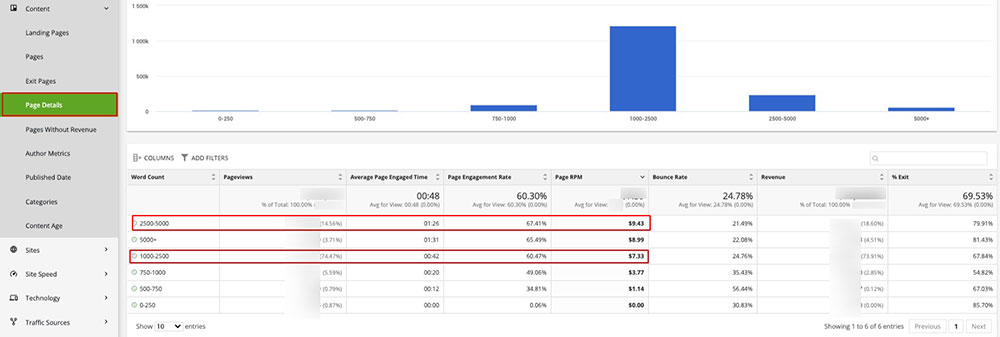
For example: This publisher’s data shows that most profitable article length range is 2500-5000 words, the second-highest-earning is 5000+ words, and the third-highest range is 1000-2500. Ironically, 74.47% of this publisher’s articles fall within this 1000-2500 (third-highest-earning) range. Articles falling in the 2500-5000+ ranges also have the highest rates of user engagement metrics.
Looking at this data, the publisher could prioritize creating longer-form content in the 2500-5000+ range and see increases in revenue and user engagement.
On the other hand, our January 2020 study on article length from 3,800 publishers showed that the article length with the highest EPMV was in the 750-1000 word range. This data proved contrary to what most in the industry believe to be fact—that long-form content reigns supreme.
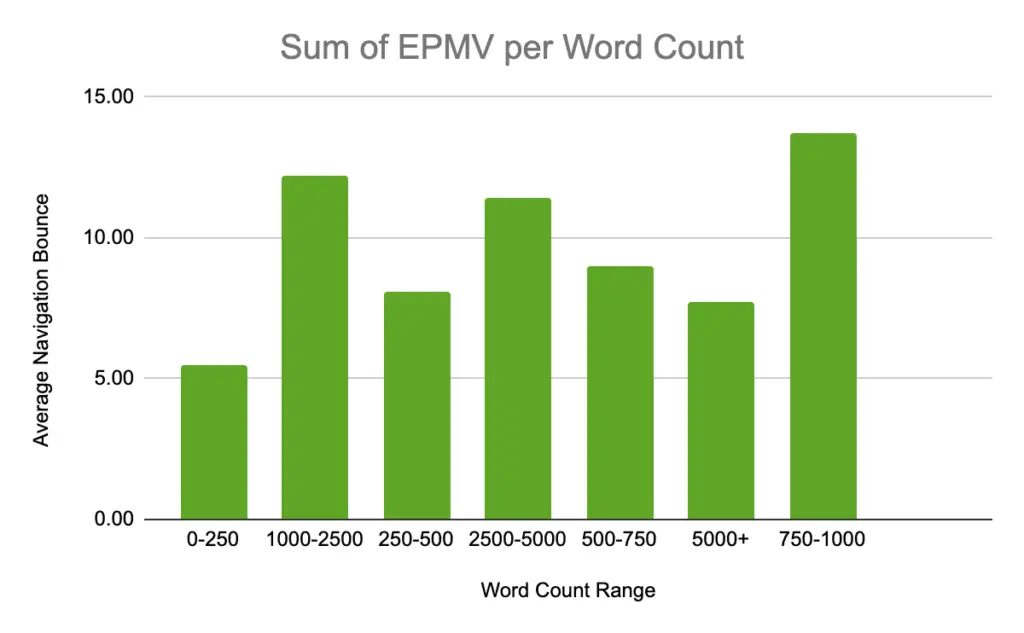
While the word count range of 750-1000 was the most profitable, articles in the 1000-2500 range and 2500-5000 range had the second and third-highest EPMVs, respectively. These two ranges are more aligned to what publishers know to be the most fruitful.
However, it’s important to remember that the most profitable word count range will vary from publisher to publisher and from niche to niche. You can use the data from this report to see which word count range on your website receives the highest user engagement and EPMV.
Here is the Page Details report in Big Data Analytics.
4. Author Metrics
The Author Metrics report within the “Content” tab of Ezoic’s Big Data Analytics is a useful report if you’re a publisher who has multiple authors writing content for your website.
Note: This report will not populate in Big Data Analytics if all your posts are published by a default “admin” username in your content management system.
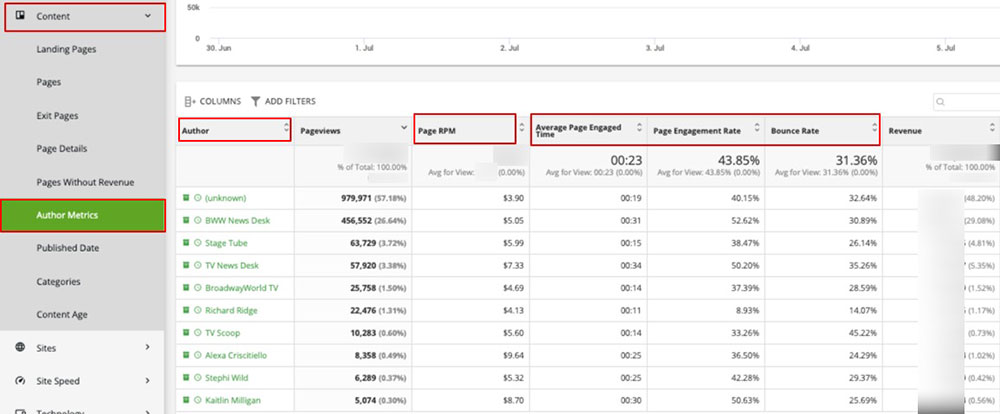
This report displays data on the article authors’ average page RPM, engagement metrics, total revenue, and more.
For example: Let’s say you’re a publisher who has dozens of guest bloggers and paid content writers contributing to your website. This report will show you which of those writers are most valuable, and help you decide who to continue working with (or who not to).
If a writer consistently has high bounce rates and low engagement rates, that might be a sign it’s time to part ways. On the flip side, a writer with high rates of engagement and low bounce rates is a valuable asset to your content production.
For Ezoic publishers, here is the link to the Author Metrics report in Big Data Analytics.
5. Ezoic Caching
For all Ezoic publishers, we recommend that you use the Caching App. These are the steps you should take to ensure you have the right set up for optimal site speed:
- Being Name Server integrated
- Caching is turned on in the Ezoic Caching App
- You need to check that it’s working in Big Data Analytics (link to report)
The Ezoic Caching report is housed within the “Site Speed” tab. Here you will see three metrics:
- Cache Miss
- Cache Hit
- Cache Off
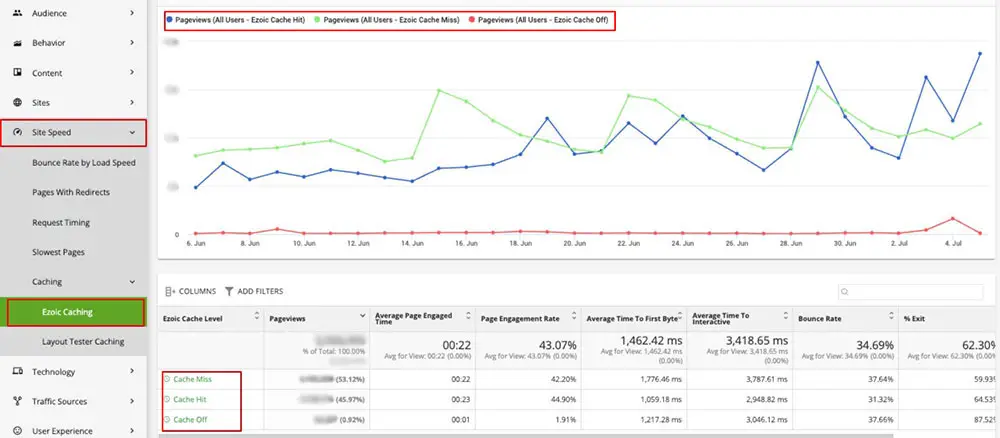
“Cache miss” generally becomes a major problem for speed when you see it in the 80-90% range. The publisher in the picture above doesn’t have that high of a percentage, but it may still be worth checking the Caching App settings. Because you may have a plugin or another setting that is causing Ezoic’s cache to be overridden.
Why do some visitors register as a “Cache Miss”?
It’s because Ezoic will always obey your pre-existing rules upon integration. Because we don’t want anything on your website to be broken or not function the way it’s supposed to.
One way to reduce the number of Cache Misses on your website is to go to your Cache App and click “Update cache setting values” and set the “Override Cache Control Headers” option to true.
Why does this setting need to be changed?
On your website, you have cache control headers that are usually being set by a plugin, service, or technology like your host. This causes your website to cache in a way that’s not optimal for your website or its users.
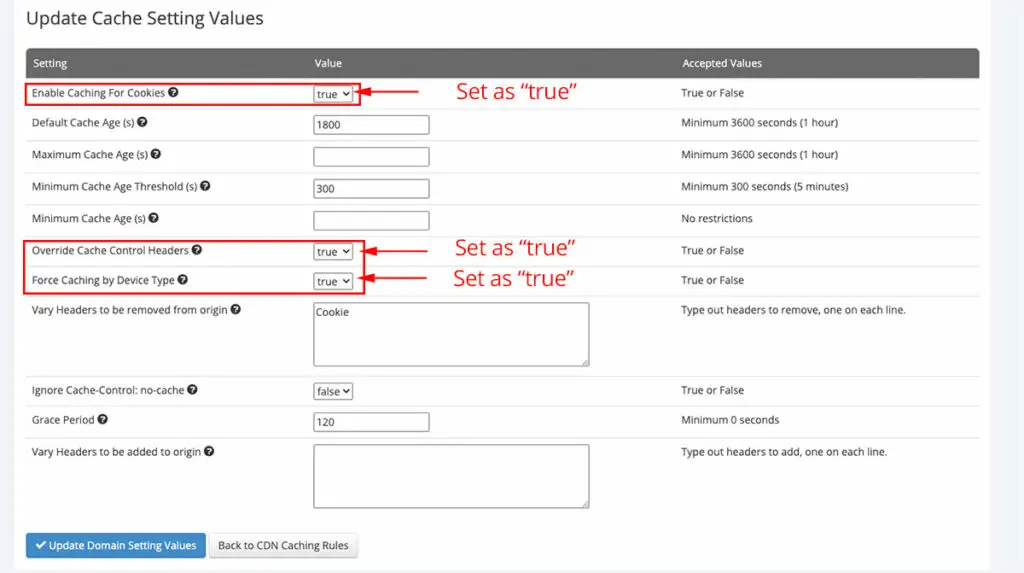
Setting this override option to “true” tells Ezoic’s Caching App to override these cache control headers from other providers in order to deliver the optimal caching to your users and improve site speed.
Additionally, you can set the “Force caching by device type” and “Enable Caching for Cookies” to true. This ensures that all devices will experience the optimal caching setup. Oftentimes, plugins might have a setting you don’t know is turned on that differentiates the caching rules by device type, which then causes the “cache miss / cache off” to appear in this report.
Once these settings are updated, give them some time to propagate before checking your Big Data Analytics Caching Report. Ideally, you want to see a high percentage of “Cache Hits”, a low percentage of “Cache Misses”, and little to no “Cache Offs”.
For publishers who want to stay on top of their site speed, the Caching App coupled with using Ezoic’s Site Speed Accelerator provides an additional suite of features that noticeably improve site speed or users and improves speed audit scores.
Wrapping up the 5 reports in Ezoic Big Data Analytics that you need to grow your site
To summarize, the five reports in Ezoic Big Data Analytics you need to grow your site are:
- Content Categories
- Landing Pages
- Page Details
- Author Metrics
- Ezoic Caching
While there are many helpful reports within Big Data Analytics, these five are the building blocks to scaling your site’s growth. Additionally, we have an Ezoic Academy playlist on YouTube that covers many how-to topics to learn more about Big Data Analytics features and reports.
Do you have any questions on these five reports? Let me know in the comments.
