Confused about what’s causing fluctuations in your Earnings Per Thousand Visits (EPMV)? Seeing a decline in EPMV over a particular date range might be interpreted as earning less money overall, but it actually signifies making less money per visitor. “Why?” is the real question, and one poorly understood in comparison to traffic. Here, I’ll show you how to dive deeper to find the answers.
Note: This blog includes links with pre-created reports for you if you’re a logged-in Ezoic user.
On its own, EPMV is a neutral metric. No two sites can ever be compared (for a lot of reasons) and if you increase traffic and make 90% more money, you’d wouldn’t trade that windfall to simply have a better average EPMV; which is academic at that point.
But, you’d be kind of crazy to not want to evaluate why — and if there’s anything you could do to lift up the average (and make even more money).
— The good news is, you’ll get the exact answers (and not a single guess) right here in this blog —
The answers are right at your fingertips, and no one else can even come close to providing a better understanding as to why EPMV is declining on your website.
For this example of exploring, I’m going to use Ezoic Big Data Analytics; because honestly there’s no other remotely easy way to get as granular or specific.
Step 1: Log in For Interactive Experience As We Go
First and foremost, you’ll need to log in to your Ezoic publisher account. Once you’re in, navigate to Big Data Analytics. Here lies the most accurate and granular method of tying traffic to revenue. Ever. Return after logging in, and click the links below as you go to land on the report pages.
Side note, it’s really strange to me how much stock sites place in Google Analytics; which is far less accurate than most publishers are aware of and offers no revenue guidance. I use Google Analytics on every site, but never for SEO or revenue which I’m much more interested in. I don’t think I’m unique so it’s strange to me sites don’t yearn for this data more.

Step 2: Set a Compare Range To Establish Baseline “Blame”
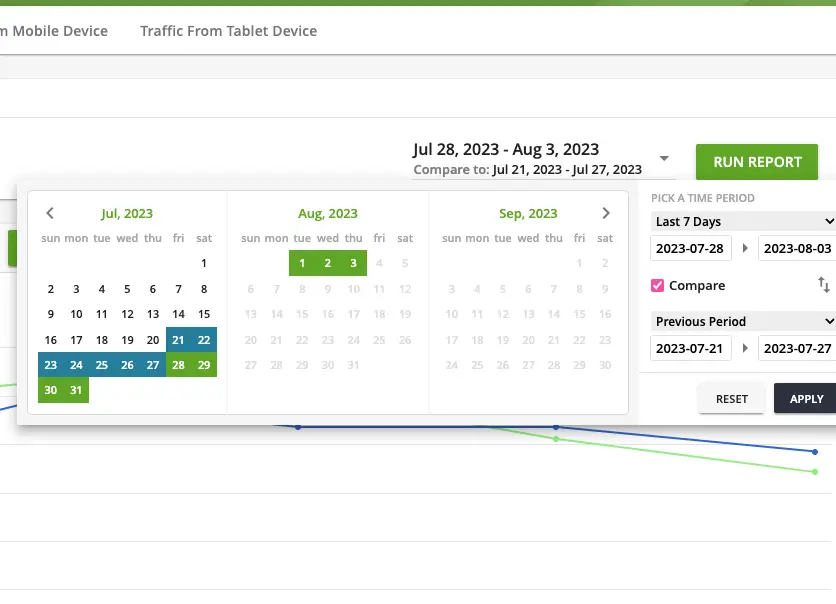
Now, set a compare range of 30/60/90 days recently vs. the previous period. Doing this will allow you to see a baseline for impact. For example, you’ll observe on average how EPMV is down or up by X% and the associated changes in visits.

If traffic is up and revenue is down, EPMV has to be down too; (unlike RPM which could be up and misleading you). Before you panic, this is typically 1 of 2 things (neither of which are the ads themselves).
- The site is receiving more traffic from less valuable audiences (we’ll look at that below); which can be good if there’s an opportunity for continued growth from that audience. Eventually, that traffic will produce higher revenue even if the EPMV is lower.
- Something has changed on the site. Ad placements, density, and ad demand (which networks bidding) all impact a page’s earnings. If any of that has changed, there can be an impact, especially if more restrictions were placed on the number or types of ads displayed.
Step 3: View The Factors Responsible For Most EPMV Declines
Next, analyze if the changes are driven by the traffic source or device type. These two factors typically cause the most significant changes in average EPMV on a single site. Check out the reports here:
Traffic Sources Causing Declines In Avg. EPMV?

Device Types reports can reveal if a new type of audience is diluting the value from past visitor demographics

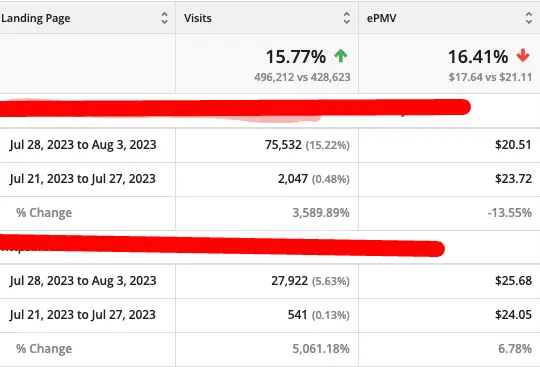
Landing Pages on many sites can vary by +200-300%

In the examples above you can see how while the data tells you everything but the source of EPMV declines varies wildly from one site to the next… perhaps a site is ranking for an article that clearly favors people searching on mobile, or maybe a new landing page is receiving traffic and it is focused on topics with fewer advertisers bidding — diluting the overall EPMV average vs. other pages.
In the last example, the site’s EPMV actually didn’t decline on any other pages than the new one that was receiving traffic. It was just bringing down the average!
// ex. If someone offered you an extra 100,000 visits a month for free, would you say no? It’s like saying no to free money.
Step 4: Analyze Traffic. Ad Rates Matter Less Than You Might Think.
Look closely at where there are outsized changes compared to the average. For instance, your newsletters may be getting more visits, but lowering your average EPMV. This might not be bad; the new readers might just be less valuable to advertisers. It might be due to an expansion in your audience to include more mobile visitors.

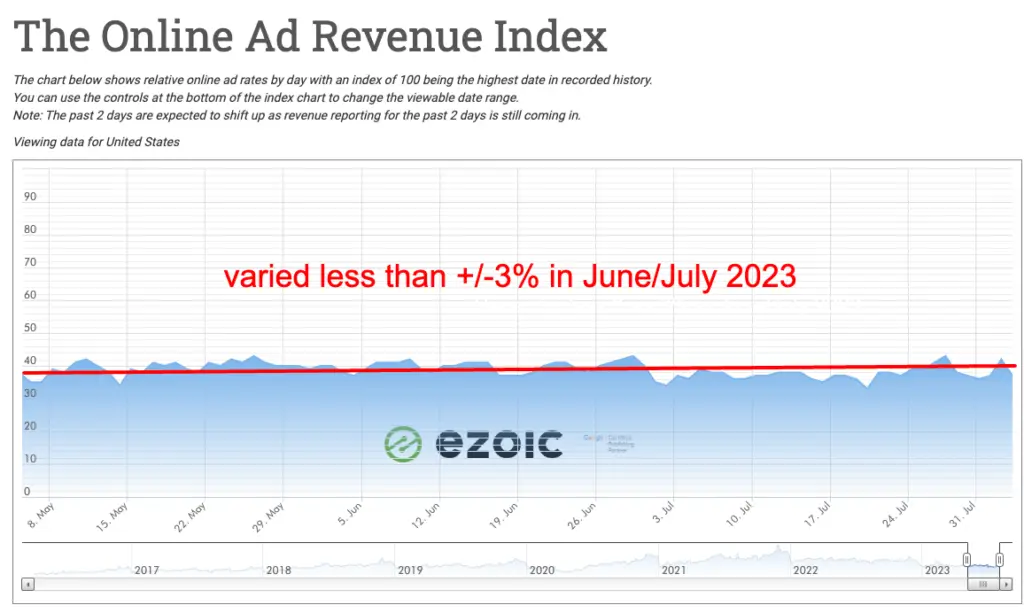
There may be something to do with the info, there might need to be more digging to do, or perhaps the data just reflects a growing audience with less value to advertisers. You can compare it to the Ad Revenue Index — gauge global rate changes by a percentage to yours to see to what degree you might be disproportionately affected.
Step 5: Diagnose Revenue with Google Search Console Data
If you notice your organic traffic is up, but EPMV is down, there’s one more critical report. Utilize Google Search Console Data tied to revenue. This information will tell you more accurately what is driving a change in EPMV.
This is a really good one if you want to know what topics you’re ranking for that are producing the most and least amounts of revenue.
Understand that it’s not simple and you’ll have a handy new weapon
I genuinely believe most sites would make 2x as much revenue in a year if they looked at this data once a month.
Realistically, differences in ad rates might fluctuate less than 20%, while other factors may drive 75-80% changes in EPMV. As sites grow, especially quickly, they may slowly dilute their audience with people potentially less valuable.
However, an average EPMV’s steady slide isn’t always a bad thing if a site is growing. Over the long term, traffic and EPMV might align more linearly as advertisers become more comfortable with a site’s track record.
You have the data, without it, you’d be guessing at best
With just a few clicks, these insights will already tell you more than most experts could guess. What’s more, you’ll discover that you already know more about your website than you thought.
Simply set the date range, select ‘compare to previous,’ and click “run report.”
The fact is, understanding the intricacies of your revenue isn’t as complex as it seems. It’s all there, waiting in your analytics. With the information I’ve provided, you’re well-equipped to diagnose and grow your website’s revenue.
The only question now is, what are you waiting for? Dive into those reports, and let the data guide your success! If you learn one thing today from this, let it be that you already know more than everyone else about your website. Trust in your abilities, and use the tools at your disposal to make informed decisions.


