One of the game-changing tools that can help website owners make informed decisions and maximize their potential is Big Data Analytics. In a recent webinar, Publisher Success Manager Kelsey Sharp shares why this reporting tool is the most robust revenue and traffic analytics reporting in the industry.
In this article, we will dive into the insights and reports presented in a recent webinar on Big Data Analytics to help publishers harness the full power of data-driven decision-making.
Game Changing Reports For Website Success
The potential of Big Data Analytics in running a successful business and website cannot be overstated. It’s a treasure trove of comprehensive reporting that can significantly influence your strategic decisions.
These reports cover a wide range of aspects crucial for running a successful website and business. Kelsey urges Ezoic publishers to explore the available reports in your analytics dashboard, learn about your audience behaviors and use this data to make informed decisions about what kind of content to write. If Ezoic is new to you, you can learn more about Big Data Analytics here.
Let’s dive into some unique reports and their applications:
Ads Per Page Report
This report provides insights into the number of ads users see on a page. It’s a valuable resource to understand the user experience and tailor ad placements for maximum impact.
*This report is only currently available to Premium publishers so you may not have access to these if you’re not on Premium.

As shown above, 32% of users only see 1 ad on a page, 23% see 2 ads, 17% see 3 ads and so on. As a Publisher, you’re likely visiting your own site multiple times a day. Ezoic technologycsees this and increases the number of ads that are shown, believing you are a reader who isn’t affected by ads and continually returning to the site. This means that your experience is not typical of what your readers are seeing.
Ad Density Report
This report analyzes the percentage of page area occupied by ads. Understanding ad density can help optimize ad placements for both user experience and revenue generation.
Did you know? Google has an Ad Density limit of 33% – the majority of Ezoic publishers do not come even remotely close to this number!
*This report is only currently available to Premium publishers so you may not have access to these if you’re not on Premium.

Word Count Report
By breaking down content into different word count categories, this report helps publishers identify the ideal content length for attracting page views, user engagement, and revenue.

The image above shows that the Word Count report breaks down word count into 7 different categories, ranging from 0-250 words all the way to 5,000+ words.
This report will show you what content length on your website tends to produce the highest amount of pageviews. For this particular domain, we can see that content ranging around 1000-2500 words tends to have the highest number of pageviews.
At the bottom of the report you’ll also see data based on each word count. This shows you insight into the user experience of that content length such as time engaged on the page and the bounce rate, but also provides insight on what content length generates the highest revenue and page RPMs as well.
This report will help you determine what article length you should be focusing on producing more of.
Categories Report
Publishers can use this report to evaluate the performance of different content categories and prioritize content creation accordingly.

*Categories need to be setup on your domain in order for Ezoic to retrieve this data
The image above shows us an example of a recipe website, specifically Italian recipes. They have categories broken down for each of their recipes, so looking at this report the publisher would be able to see what categories attract the highest pageviews and also which perform best form a user experience and revenue standpoint.
In this example, we can see that Recipes and Secondi Piatti has the highest visitors and the highest revenue, but the Appetizers and recipes category actually generates a higher page RPM.
Audience Tab
Understanding user demographics, language preferences, location, and even weather conditions can inform content strategies and audience targeting.
Ezoic publishers may not realize how much information they can get on their audience. You can see data on your users based on the language they speak, even a breakdown of the location of your users. This can get broken down by country, state, metri, city, and even their postal code!

The Local Times report shows the day of the week and even the hour that users frequently visit your site. This varies very differently based on each site and even the niche. For example, with recipe sites, Kelsey shares that she tends to notice weekends are higher traffic, usually when people are planning their meals for the week. This report also breaks down which hour most users are on your site. The local times report can be helpful for publishers to know when they should be pushing out new content.
Kelseys favorite report within the Audience tab is the weather report. This report shows the overall weather summary for your users, the temperatures where your users are located, and even the chance of precipitation! The data that is shown in the audience tab is so granular and can be really useful in understanding who is looking at your site and viewing your content.
Site Speed Reports
Reports on caching and core web vitals are critical for optimizing site performance and user experience.

The Caching report outlines the metrics for pages that are cached with Ezoic, resulted in a cache miss with Ezoic, or are not cached at all. You can very clearly see the difference in speed with a page that is cached with Ezoic under the cache hit category vs a page that results in a cache miss or cache off. There’s a 55% increase with the cache hit and cache off under the average time to interactive!
It’s also worth noting that the page RPM is highest when the page is successfully being cached. You can see the cache hit rate right in your dashboard when you login to your Ezoic account.

The Core Web Vitals (CWV) report will show you a break down of each CWV metric.
Annotations
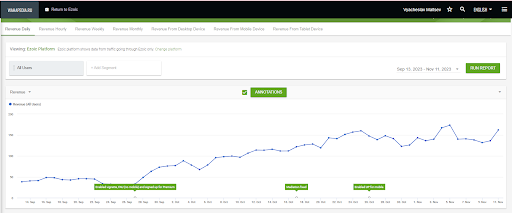
Annotations allow publishers to leave notes on specific dates, helping them track the impact of changes and optimizations made over time.

Annotations are helpful when making changes or enabling/disablign certain settings. It can give you a great at-a-glance view of overall site performance. In the image above you can see in that first annotation vignettes and floating ad units were enabled and the publisher signed up for premium, and you can actually see the increase in revenue after this.
If you’re not currently using annotations, I highly recommend utilizing these moving forward.
Conclusion
Big Data Analytics is a powerful ally for publishers looking to improve their websites, understand their audience, and maximize revenue. By leveraging the various reports and insights discussed in this webinar, publishers can make data-driven decisions that lead to growth and success.
In our constantly evolving digital landscape, staying informed and utilizing the right tools is essential. Big Data Analytics is one such tool that empowers publishers to thrive in the competitive world of online content. With the insights gained from this webinar, publishers are better equipped to navigate the complexities of the digital realm and ensure their websites remain at the forefront of their respective industries.
If you are an Ezoic publisher, you can watch a recording of Kelsey’s webinar here. Weekly Walkthrough webinars happen every Wednesday, check out past recordings and register for future events here.


