The start of Q1 is typically when ad rates are at their lowest. Historically, a website’s annual revenue is not equally split between quarters which begs the question, what percentage of annual revenue do publishers earn in each respective quarter?
Despite what 2020 brought, many publishers still saw high ad rates in the fourth quarter. Typically Q4 will be a time for record revenue for websites, as ad rates soar and most publishers accrue more revenue than any other quarter. But just how much more profitable is Q4 than other quarters, and what do revenue trends look like per quarter?
Based on data from our Ad Revenue Index, we’ve compiled information on what percentage of revenue publishers make, per quarter, of their yearly revenue.
Looking at the Ad Revenue Index, we can see that there is the same pattern every year; there is a big uptick around December, followed by a big dip in ad revenue in Q1. This progressively rises and then dips at the start of each new quarter, though continues its upward ascent through the year.
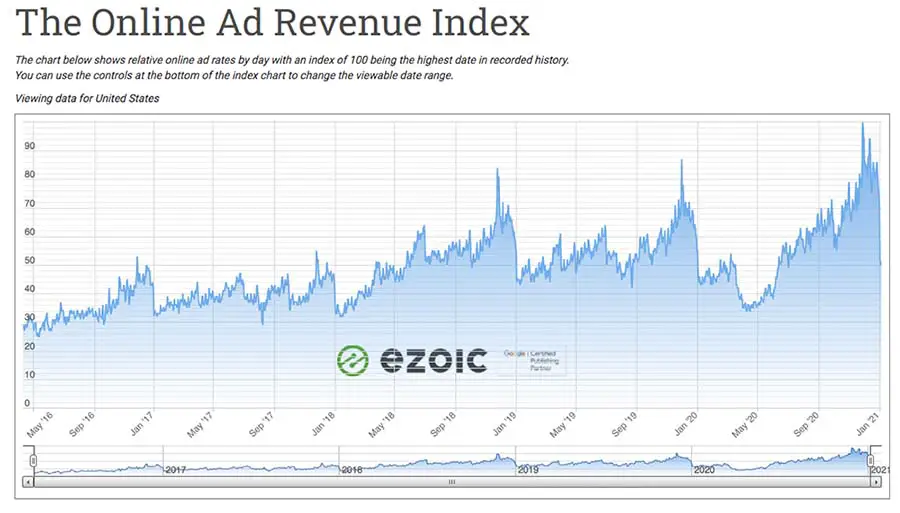
Q1 ad revenue vs. Q4 ad revenue
If we look more closely at the data, we can see that the percentage of annual revenue that Q1 brings in is usually one of the lowest percentages and Q2 is typically a bit better. This is followed by a decrease in revenue for Q3 before ramping up again in the holiday consumer spending often seen in Q4.
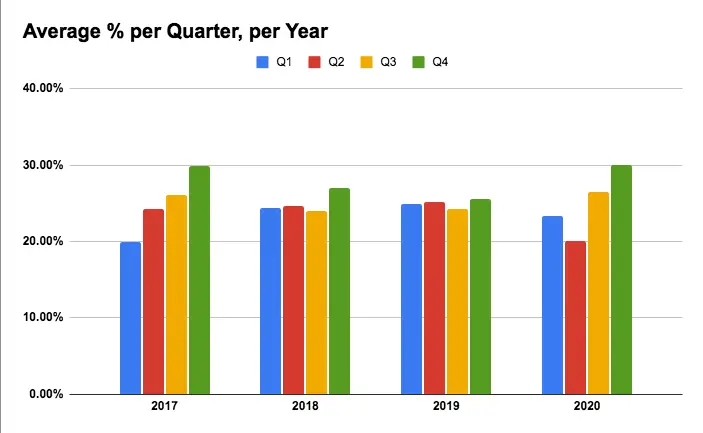
Both 2017 and 2020 bucked this common trend.
See more trends from 2020 that may apply to 2021 here.
Third-quarter spending was higher than Q2 spending in both years; this was especially true for 2020, where Q1 started off at normal rates but then plummeted as COVID-19 swept across the world. This was then countered by rises in ad rates in Q3, which is typically a slower quarter for publishers, and then much higher ad rates for Q4 as advertisers honed in on opportunities available digitally with their remaining ad budgets.
When do websites earn the most from ads?
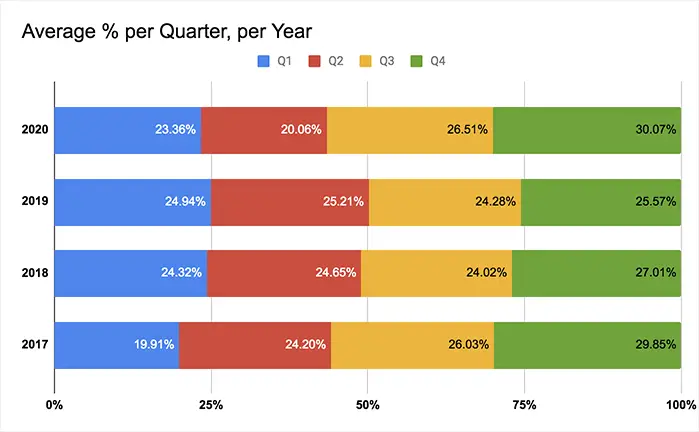
If we look at the combined average quarterly percentages, we can see that these trends are not quite the same as when broken down each year. In fact, it’s safe to say each year is a little bit different, even if we can find some general similarities that publishers can come to expect.
Generalities with publisher earnings can be directionally helpful, but as it is often pointed out, ad rates can vary wildly by the publisher — even if they have a website in the same category, niche, and with the same geographical traffic as another website
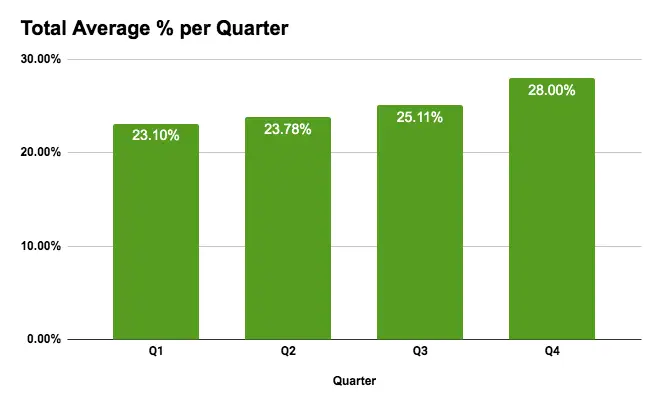
Above, we can see just how close Q1 and Q2 spending is on average, followed by a slight uptick in Q3, which then leads up to Q4 averaging the highest percentage of revenue. This may be a surprise to some websites that may see upwards of 50% of their annual revenue come in just 2-3 months at the end of the year.
What do websites do when ad rates drop?
Because Q4 makes the most money of any quarter and Q1 makes the least, it can be jarring to publishers when that transition happens. However, this drop is normal and publishers shouldn’t typically worry. There are opportunities that exist for websites, both when ad rates are high and when they are low. Strategizing on how to take advantage of these changes can be a part of annual planning and should be analyzed carefully before mass changes are made.
We’ve covered the mechanisms behind these seasonal ebbs and flows in previous articles if you’re interested in learning more. Additionally, this is a time when major advertisers are strategizing and deciding on advertising budgets for the rest of the year.
Campaigns will launch throughout the month in January and typically continue in their cyclical fashion from there. Advertisers are likely to continue to conservative as there is still uncertainty regarding COVID-19, so publishers may see lower rates this Q1 than previous years; however, 2020 showed everyone that unprecedented times could yield unprecedented results (and not always in a negative manner).
