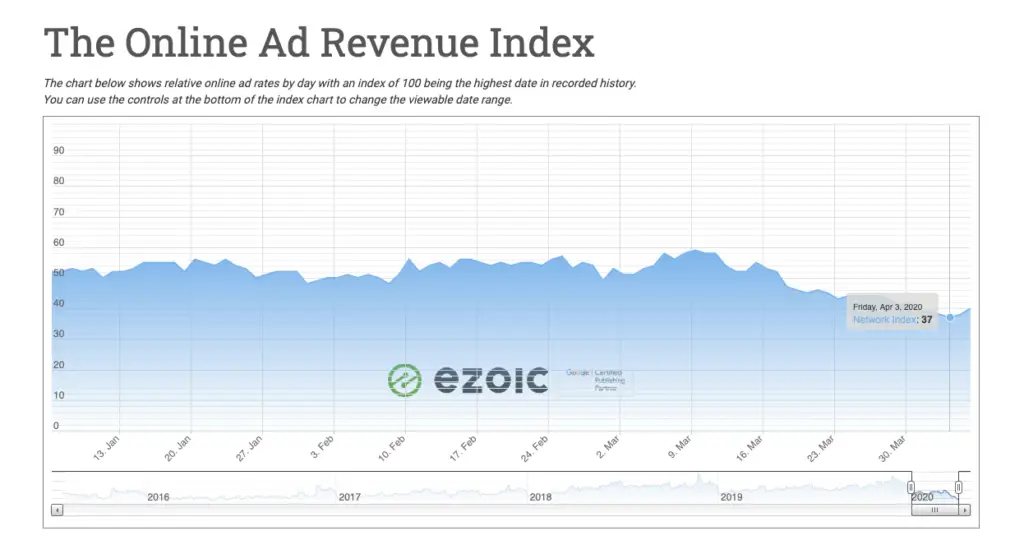
Ezoic has been covering how the Coronavirus is affecting ad rates with live updates daily. As more data is rolling in, we want to keep publishers up-to-date with the best information possible to help weather the storm during this uncertain time. The most recent data from the Ad Revenue Index has shown that Q2 ad spend has produced a historic low for ad rates. On April 3rd, an index score of 37 was recorded.
Today, I’m going to walk you through how decreases in ad spend are contributing to historically low ad rates.
How Q2 ad spend is historic
Normally, at the beginning of every quarter, a downturn in ad rates occurs. Then things trend upwards throughout the quarter.
Since the spread of the Coronavirus, the industry is witnessing some of the lowest ad rates we’ve ever seen. Thursday, May 12, 2016, was the last time the ad index was this low.

Throughout the last few years, ad rates experienced linear improvement across the board. Ad rates rise and then fall at the first of the month, the beginning of a new quarter, and the beginning of a new year. The end of the year drop is the most dramatic. This effect stems from the way marketers run their advertising budgets.
The largest spikes occur on Black Friday. This is usually when the record ad rates are set. Additionally, Q4 is normally the highest-earning time for publishers across the web.
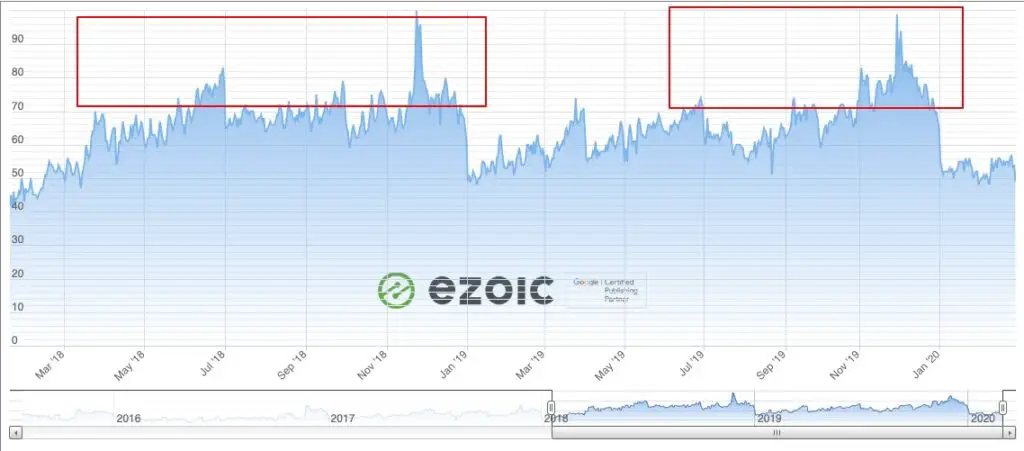
Q2 ad spend for 2020 has hit rock bottom after the Coronavirus flatlined Q1. There is typically some growth at the start of Q1, and since then, we’ve seen a pretty dramatic dropoff.
How decreases in demand are affecting programmatic advertising
2019 vs 2020 ad rates show that 2020 has been a little bit lower to start. But it wasn’t until March whenever the Coronavirus started spreading into North America that advertisers have adjusted their budgets so severely.
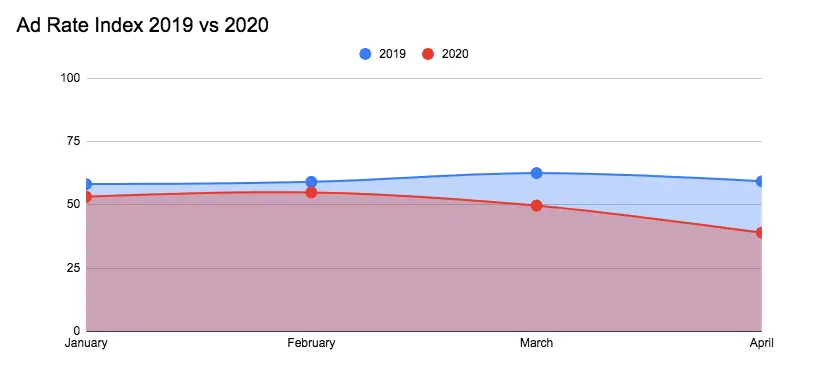
The 2020 line is doing fairly well until the second week of March. Then ad rates begin to decline and now are diving well below 2016 ad rates. These declines in ad rates have negatively impacted publisher ad earnings, and it’s primarily been driven by reductions in ad spend.
For example: Around March 13th a major hotel brand drastically reduced their advertising spend on their campaign. Many advertisers are having to reduce costs, whole industries are asking for government bailouts, and this is resulting in lower overall competition.
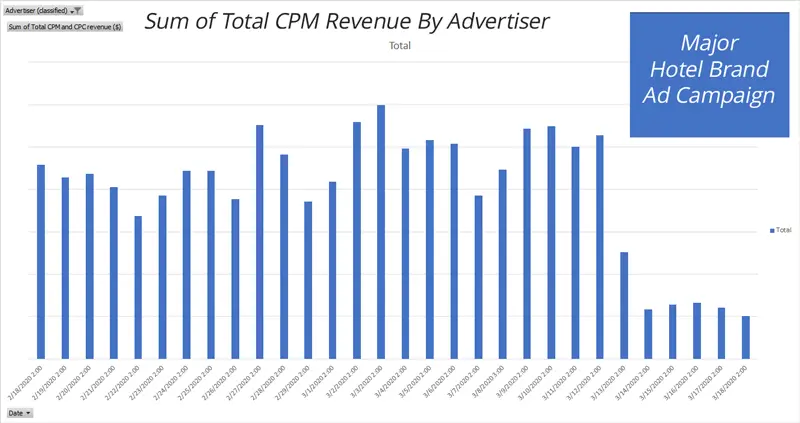
Not only are advertisers spending less—so publishers aren’t getting revenue from those advertisers—but this is actually impacting competitive auctions on publishers’ sites.
Historical bidding data is what programmatic auctions are based on. These declines in ad demand might get worse as more advertisers drop out and competition gets lower and lower.
The harm to publisher revenue is compounded by platforms like Google Ad Manager because they’re designed to help advertisers understand where they can bid lower.
Supply and demand are critical to ad demand and spend
For most publishers, supply is going up. This is especially true for news publishers who cover Coronavirus topics. They are providing more and more ad impressions than they ever provided before.
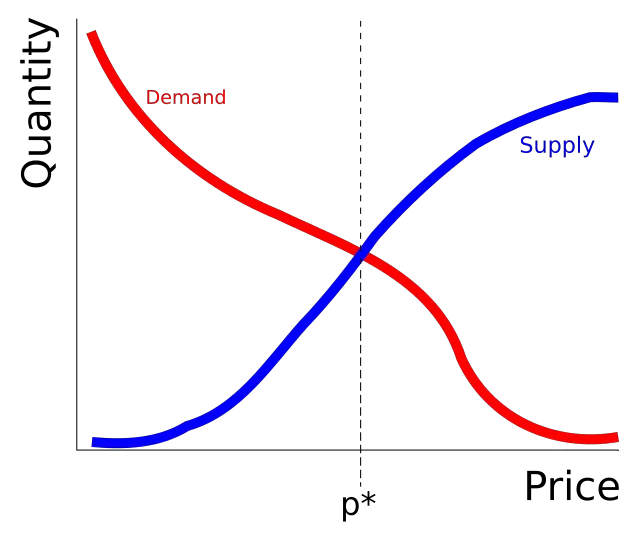
The flood of supply leads to a decrease in demand, and then demand becomes diluted even further. Now there are fewer advertisers bidding even less on more available ad space than previously existed.
The ideal environment for publishers who monetize with ads is a limited number of ad spaces with lots of advertisers competing for those spaces. What we’ve seen in the case of the Coronavirus pandemic is fewer advertisers bidding a lower amount. This is decreasing the value of publishers’ ad inventory.
Tip: Publishers should avoid increasing ad impressions (or their ads on the page) to better monetize the fact that they may be writing about the Coronavirus.
The only way to combat increased ad supply and low ad demand is by testing ad different sizes and locations to produce increased competition.
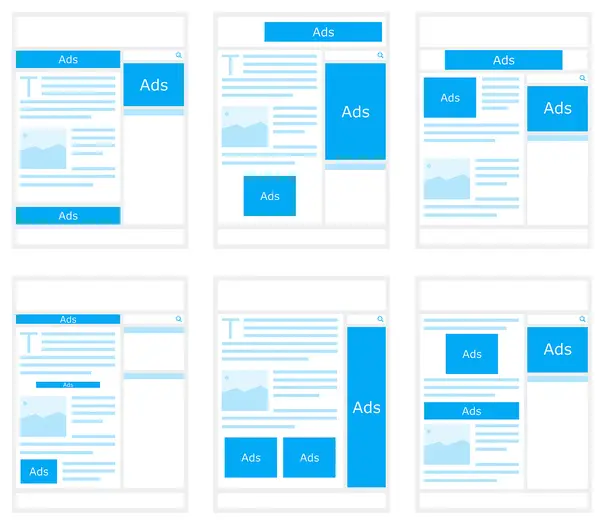
You can understand this supply and demand problem by looking at what’s happening with the airlines.
For example: If Southwest reduced the number of flights, they are probably going to see slightly higher demand. And even with the reduced competition, they’ll be able to charge more closely to their normal rates for their flights.

If they tried to combat their lower revenue by adding more and more flights, they’re going to see lower demand because people aren’t traveling right now. They’d have to firesale their seat inventory.
This is exactly what’s happening with publishers right now. The decreased demand and the increase in their inventory cause the price they’re getting paid for their ad inventory to get lower and lower.
Will Q2 ad spend increase in the future?
As the pandemic gets worse, advertisers will hoard as much cash as possible. Once people go back to work, Q2 ad rates are likely to improve. Traditionally, the end of Q2 performs pretty well. Once advertisers’ confidence in the future improves, ad spend will increase, and demand will start to go up.
Until then, publishers need to focus on the number of ads on the page, their sizes, and locations. Controlling these elements are the only real leverage publishers have to restrict the supply as the demand continues to diminish.
This advice is especially true for sites that are in travel niches or other niches that have advertisers that are disproportionately impacted by this.
Publishers that use Ezoic’s Ad Tester already have the benefit of optimizing ad sizes, ad densities, locations, and more. Ad Tester is powered by real machine learning that uses continuous multivariate testing on a per-user, per-visit basis to increase ad revenue and UX metrics.

This technology has helped Ezoic publishers not only survive but thrive during a time where ad rates have plummeted.
Do you have any questions on Q2 ad spend? Let me know in the comments.


