There is a preconceived notion that the more content you can pack into an article, the better, and that longer articles tend to perform better.
What we’ve actually found is that the highest-earning articles aren’t generally extremely lengthy. And, they aren’t just all words. So, what else are these publishers including in their content?
The answer to better content is visual media. We’ve all come across an article that seems to just drone on and on without any break, until we’re hardly even skimming the page. That’s because having media items to complement and break up the content is vital to readability, SEO, ad revenue, and user experience.
There are multiple types of visual media that can be used to enhance the viewers’ experience while also earning more money. Below, we review what these media sources are and cover the importance of each to ad revenue and user experience. We’ll also provide examples of Ezoic sites using media in different ways to increase EPMV, revenue, and user experience.
How can I make my blog posts perform better?
First, if you’re not including video as a content source yet, you need to begin. Video is the fastest-growing ad market in digital publishing; in late 2021, it was estimated to rise 26% to $63 billion, and that number only continues to grow. Additionally, having videos on landing pages increases the conversion rate by 86%.

Not only is video good for ad revenue but it can also serve to break up and enhance your content. Serving videos inside your written content can help the reader better understand what you are writing about, give visual context, and give a better explanation than simply using words.
However, adding just any video to your content isn’t enough. To start, it needs to be relevant to the blog; the video needs to add something to the article, not just act as a placeholder. For example, something we have seen publishers do is add a video of someone reading the blog over a random video and embed it in the blog. This ultimately does nothing for the reader and lowers the value of your blog.
To include video in your articles, you first need to consider how you want to host your video. YouTube is by far the most popular, though you lose out on ad revenue. Ezoic has its own video service where you can upload your videos and earn ad revenue, just like traditional ads.
Possibly even more important than videos are images. Articles with images receive roughly 94% more views than articles without. Images are similar to videos in that they help break up text and give readers’ eyes a break.
Images can include literal photographs or something like infographics and charts. These can not only break up content, but they can also further emphasize and validate the information you’re relaying. Just like videos, they shouldn’t just be included because ‘you should include images.’ The images, charts, infographics, and/or data sets should be relevant to the material and help enhance the experience of the viewer, not just take up space.

Top-performing sites that include visual media
Let’s take a look at some Ezoic sites and how word count, media, and site performance relate to one another.
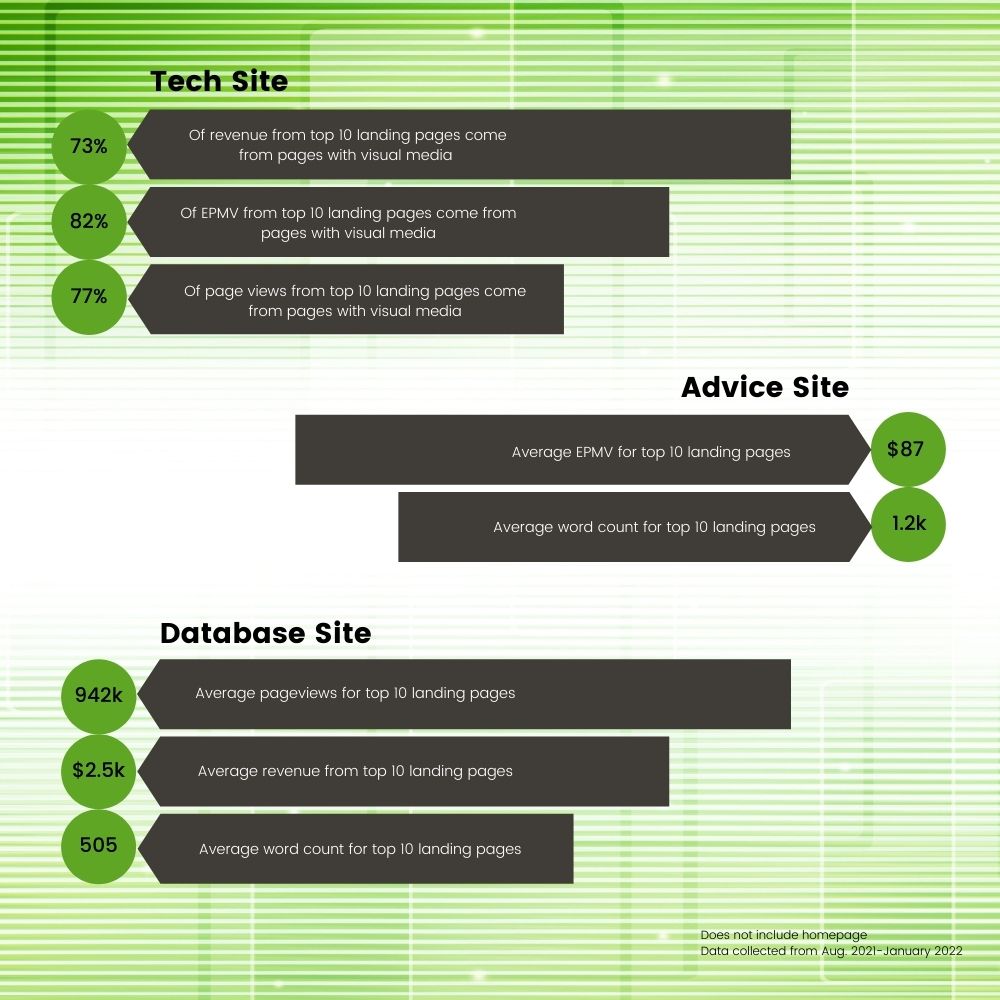
The first site we’ll look at is a technology site. On this site, the articles earning the highest revenue in the last six months are articles with a word count between 1,000 and 2,500 words. What’s important to note about its top-performing pages is that most of these articles include media of some kind.

However, what makes this content unique isn’t necessarily including images. A lot of this site’s top-performing articles include a video at the top, usually reviewing the product. The video is a visual representation of the information to come and provides another content source for viewers to consume.
Looking at a site on website scam advice, they have also earned the most money from posts with 1,000 to 2,500 words in the last six months. What makes this site successful isn’t the length of its content, however. This site is great with infographics and charts. The article with the top EPMV has 1,396 words and includes a chart at the top, a few paragraphs of content, and then a data table at the bottom. This type of setup is true for most of its top 10 posts since August 2021.

The last site we’ll look at has shorter content than the previous two but still includes plenty of media within the content. The site, a database website, sees the best performance on articles with a word count between 250 and 500.
Similar to the website scam advice site, what makes this site unique is its data setup. While the main content itself is pretty short, the data table includes a lot of useful information that supplements and further elaborates on the content already given. Though the site has fewer words than the other sites we’ve looked at, it is successful because of how well the data is structured on those specific pages.

To put it simply, sites using visual media of some kind to enhance their articles perform better.

This all goes for Ezoic’s blog as well. Some of Ezoic’s top landing pages are blogs with multiple images scattered throughout the post. For example, our top-performing blog over the last 6 months is How to Keep Columns Side-By-Side On Mobile in Divi. The blog itself has 595 words and placed throughout the article is 8 images. This is especially important in this blog because it is a technical how-to and seeing how to perform the steps is essentially vital to the success of the reader.
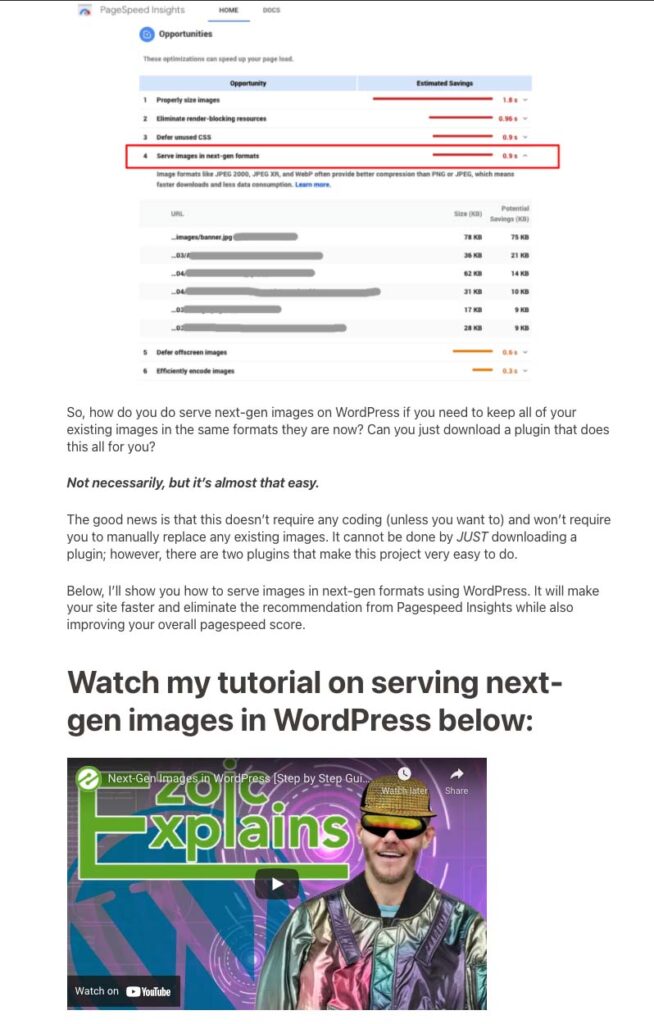
Another one of Ezoic’s top blogs is How to Serve Images in Next-Gen Formats Using WordPress. This blog, which has 2,032 words and 11 images, also includes a video that covers the material as well. The video itself is Ezoic’s top-performing Ezoic Explains video.

Include visual media in your blog posts
In summation, adding visual media to your website can only benefit you. Sites of all sizes use images, videos, infographics, charts, and data sets to break up content, enhance user experience, and increase revenue.
If video seems intimidating, don’t worry–there are plenty of online resources to begin using video. We have a blog on video gear choices, but depending on your built-in computer camera, you could potentially just use that.
Not sure where to start? Look at your content and consider what visual elements would be helpful for viewers to see. Are you writing about something tangible, like new phones? Include pictures of the phones. Are you writing a how-to? Include visual, step-by-step instructions alongside your content. Are there too many images and information to include? Consider putting them together in a video.
The world is visual and it’s time to begin including visual media in your posts, to the benefit of both you and your audience.

