PUBLISHED 7/5/23 at 2:15PM
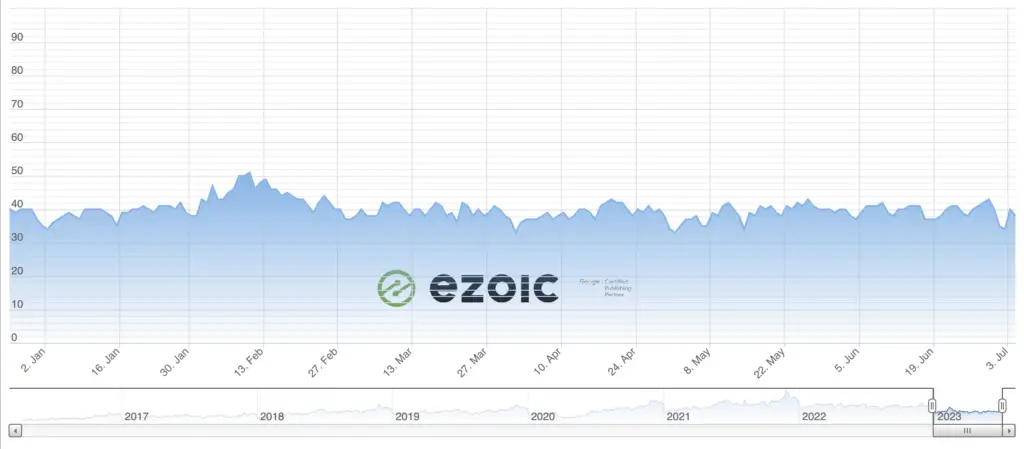
The good news? Ad rates have been pretty steady all year. The bad news? Ad rates have been pretty steady all year.
Ad rates have neither gone up or down for most of the year. While there was a slight peak at the beginning of February, it’s fair to say that the first half of the year didn’t provide much for publishers to get excited about.
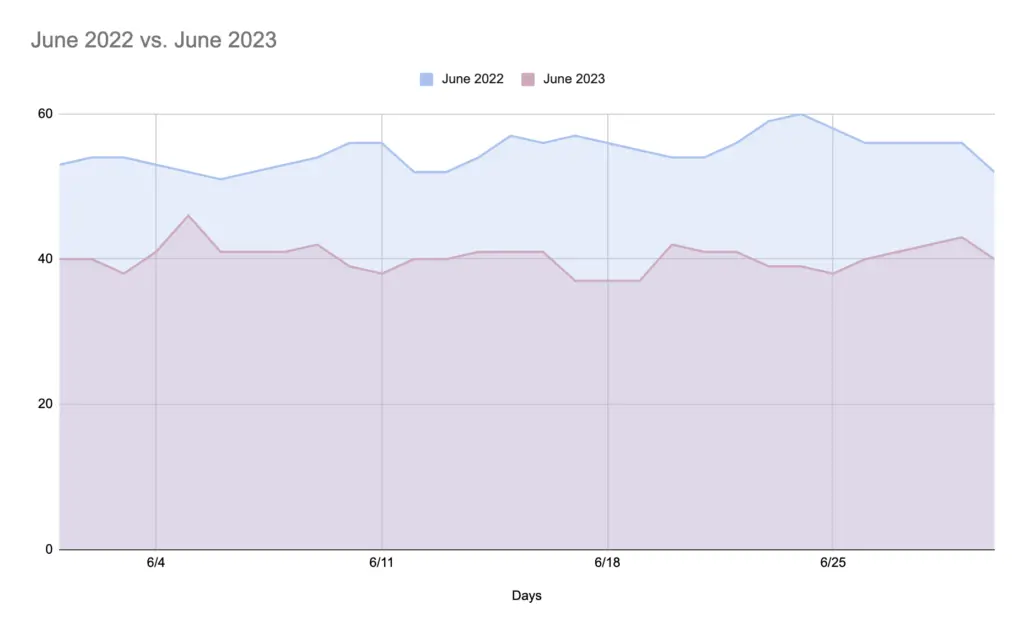
Ad rates for June 2023 are below last year’s rates for the same time period by about 15-20 points. However, as we’ve stated before, ad rates during the pandemic were an anomaly; there was a big dip at the beginning of COVID-19, and then a big surge in ad rates as companies tried to make up for lost time. However, as it became obvious that the economy was heading downwards, ad revenue returned to lower levels.
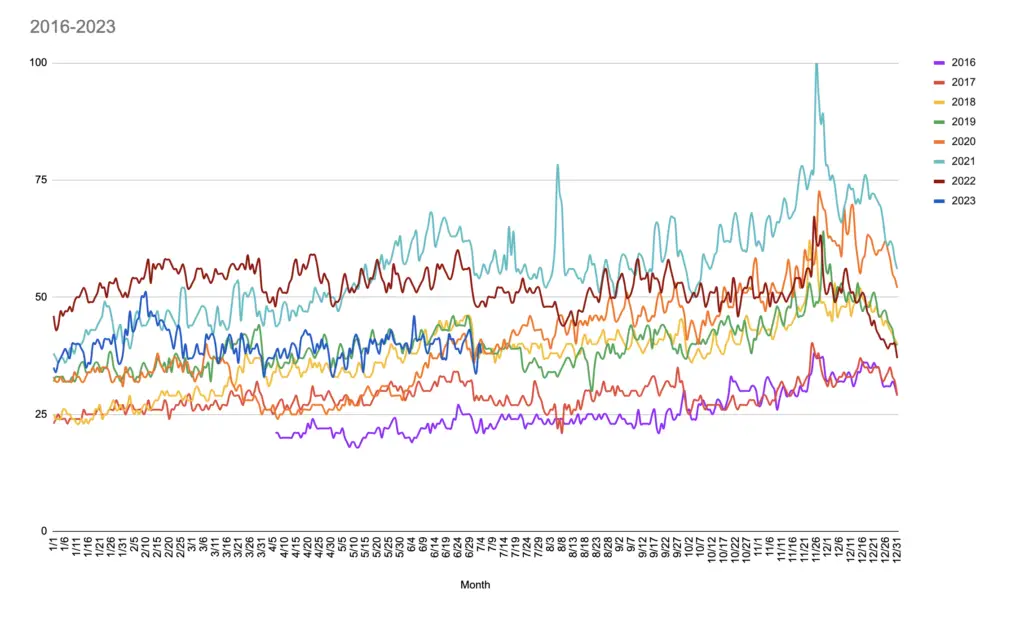
Looking at ad rates since Ezoic began recording them in spring 2016, ad rates are right around where they were before the pandemic. However, economic factors like inflation (currently up 17.7% from 2019) mean ad rates may not be providing the same income publishers experienced in 2019.
Google ranking volatility without a confirmed algorithm update
If ad rates aren’t getting you down, maybe your Google ranking is.
Another unconfirmed Google Search ranking algorithm update has taken place, beginning on June 28th and continuing to generate significant activity. The volatility of the Google Search results has persisted for several weeks, leading to fatigue among those reporting on these changes. Despite the anticipation, Google has not yet provided official confirmation of any recent search ranking updates. Previous unconfirmed updates were reported on June 23rd, June 19th, June 14th, June 6th, May 22/23rd, May 17th, May 10th, and early May. The last confirmed update occurred in April 2023, known as the reviews update.
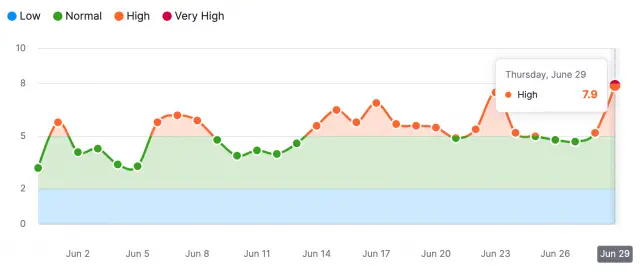
While there is no way to pinpoint what exactly may be causing ranking volatility for some—and usually, it has nothing to do with Google but instead something outside of a Google algorithm that happened to a publisher’s website coincidentally at around the same time—we’ll keep an eye out for anything Google may have to report in the coming weeks.
Google is constantly making adjustments to its algorithm without the need for a major algorithm update push or reveal; in the wake of Google’s plan to implement more AI into search, it is especially likely that many of the changes they are pushing out right now have something to do with including artificial intelligence in some way.
AI, search engines, and how it affects publishers
Speaking of AI and search engines, generative AI tools like ChatGPT have the potential to disrupt search engines, causing concern among publishers who heavily rely on search as a referral source. While these AI tools don’t search the internet like traditional search engines, they can provide personalized responses based on the data they’ve been fed. This personalization aspect could lead to AI replacing search engines in the future, with the next leading search engine likely resembling a personal assistant. Companies like Samsung and Google have already incorporated AI chatbots into their devices as alternatives to traditional search engines.
While major changes to search aren’t going to happen anytime soon, to prepare for a world without search in the future, publishers need to reduce their reliance on search traffic and focus on building direct audience relationships. Publishers should provide opportunities for engagement on their own platforms, collecting first-party data like email addresses, comments, and user behaviors to personalize experiences and learn about their readers.
Some publishers may not have any idea where to start in targeting and personalizing their audience relationships. We have blogs that cover just that.
Gen Z and AI for publishers
Gen Z is the newest generation entering adulthood that publishers need to begin to understand in order to best give them the content that want. Gen Z refers to the cohort born between the mid-1990s and early 2010s, meaning they are roughly 10-27 years old at the time of this publishing. They possess distinct characteristics that differentiate them from previous generations that publishers should begin to consider when creating content that will engage younger audiences.
This young generation is collaborative, adaptable, and resourceful, having grown up in a digital age that emphasizes connectivity and teamwork. They exhibit a strong social consciousness, actively advocating for societal change and promoting inclusivity.
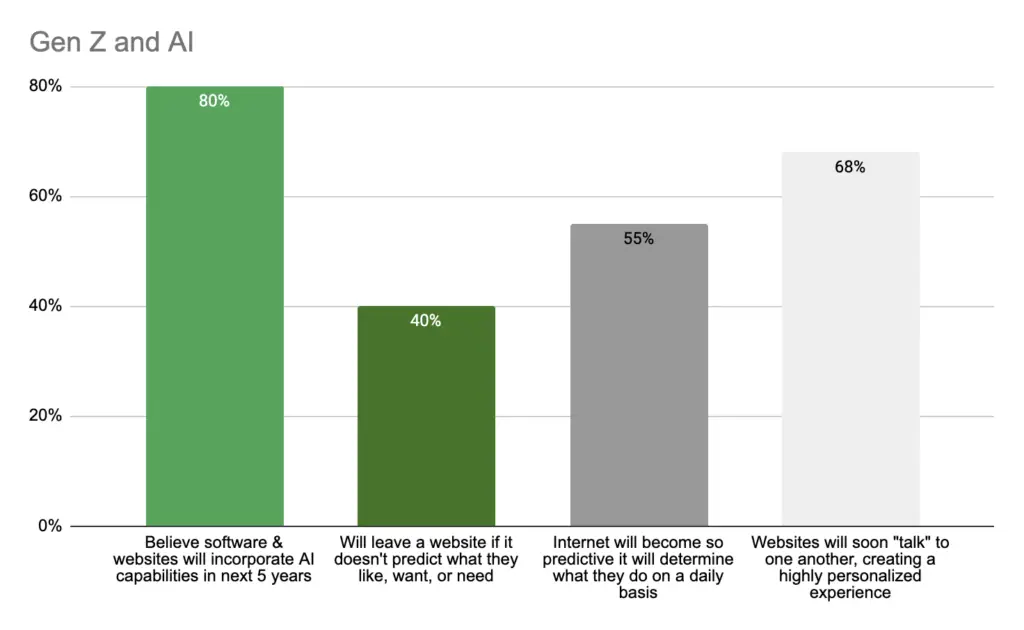
More importantly, Gen Z’s relationship with technology is unique, as they have a deep engagement with and reliance on digital tools, demonstrating a high level of tech-savviness and digital fluency. Social media, particularly platforms like TikTok and Instagram, plays a significant role in their tech engagement, shaping their affinity for visual and interactive experiences.
Gen Z values authenticity, personalization, and transparency in their tech experiences. They have a keen interest in AI and are open to expressing their opinions and seeking unique identities online. The continuous advancement of AI and machine learning technologies further influence Gen Z’s media habits, from personalized recommendations to virtual assistants.
Publishers can use AI to learn more about Gen Z and how to target this specific audience, including topics they are interested in and how to create personalized content.
Publishers using TikTok increasingly frequently
TikTok has become a leading social media platform, attracting a growing number of young users. Despite potential regulatory challenges faced by its parent company, ByteDance, news organizations are still investing in TikTok due to its immediate benefits.
Publishers prioritize growing social followers and engagement, aiming to capture audiences who may follow them on other platforms or subscribe to newsletters in case TikTok becomes unviable. Moreover, TikTok’s influence has reshaped the landscape of social media as a whole, prompting platforms like Facebook, Instagram, and YouTube to adopt similar features. Publishers believe that even if TikTok is banned, the innovations it introduced, such as short-form vertical videos, will persist on other platforms like Meta’s Reels and YouTube Shorts.
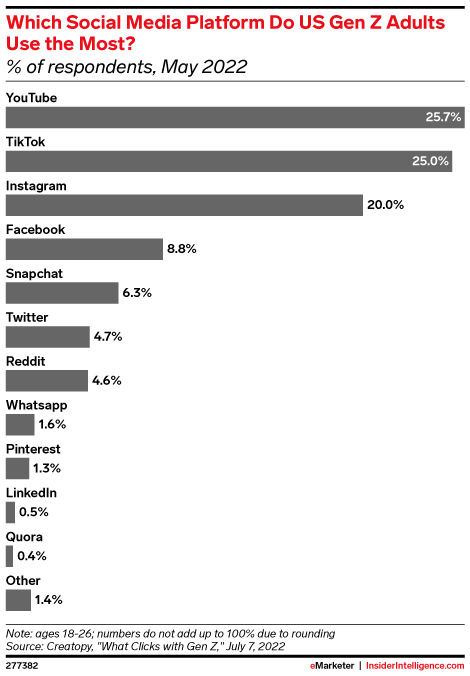
The ability to create viral content on TikTok is not limited by follower numbers, offering all publishers an opportunity for exposure. Timing plays a crucial role in maximizing TikTok’s potential, as the platform’s recommender algorithms promote content based on engagement and watch time. Leveraging AI-powered social media management tools to optimize post timings can enhance visibility.
Despite the uncertain future of TikTok, its immediate benefits, such as access to a large young user base (Gen Z and young Millennials), make it an appealing platform for publishers. By combining AI strategies and forward-thinking approaches, publishers can establish themselves as trusted sources with or without TikTok.
Microsoft advertising unveils sweeping policy updates effective July 1st
Microsoft is urging marketers to review and adjust their ad campaigns in preparation for a major policy update. The update, which rolled out on July 1, will bring significant changes to Microsoft Advertising accounts. The aim of the update is to help marketers reach larger audiences and enhance consumer security in line with upcoming regulatory changes. Two weeks prior, Microsoft had announced the introduction of a new Cross-Device attribution model.
The new policies include allowing vitamin and supplement ads on the Microsoft Audience Network, with the condition that claims are accurate and truthful. Gambling ads will also be permitted, but only if marketers are licensed in the target market and have undergone the necessary approval process. However, in Belgium, Microsoft will enforce a ban on gambling ads to comply with local laws. In Ireland, restrictions on gambling ads are being introduced, but the exact date is yet to be confirmed. Additionally, starting from August 1, Microsoft will globally ban ads promoting clinical trials or experimental treatments across all ad types.
These policy updates will impact various aspects of Microsoft Ads accounts, including ad and ad component disapprovals, store or product disapprovals, a three-strike violation policy, and immediate suspension penalties for egregious violations. Microsoft states that the changes are intended to provide greater visibility for advertisers and users while aligning with regulatory requirements.
Halfway through 2023
In summary, the digital advertising landscape presents mixed news for publishers halfway through 2023. Ad rates have remained relatively steady throughout the year; however, economic factors like inflation may impact publishers’ revenue potential. Furthermore, there has been significant volatility in Google search rankings due to unconfirmed algorithm updates, causing concern among publishers.
The rise of generative AI tools and their potential to disrupt traditional search engines adds another layer of uncertainty. To mitigate these challenges, publishers should focus on reducing their reliance on search traffic, building direct audience relationships, and personalizing content to engage younger audiences, particularly Gen Z. TikTok has emerged as a popular platform for publishers, despite regulatory challenges, and leveraging AI strategies can enhance visibility on the platform. Additionally, publishers need to stay informed about policy updates from advertising platforms like Microsoft to ensure compliance and maximize audience reach. Amidst these changes, publishers must remain adaptable and forward-thinking to thrive in the evolving digital landscape.
We’ll be back in two weeks with another update!
PUBLISHED 6/22/23 at 5:30PM
What’s been going on in digital publishing and with ad revenue in the past couple of weeks?
The digital advertising landscape is undergoing significant shifts and transformations. From algorithm updates impacting search rankings to regulatory changes in artificial intelligence and antitrust charges against tech giants, the advertising industry is experiencing a dynamic and uncertain environment. The rise of AI, particularly exemplified by ChatGPT, presents new challenges and opportunities for dominant players like Google and Meta.
On top of all of this, ad rates are mostly stagnant though there has been a slight increase MoM.
Some ranking volatility from Google
There was a Google Search ranking algorithm update on June 14th that has made waves for the past week and it doesn’t seem to be mellowing out. This chart from Semrush shows how volatility has fluctuated since mid-May.
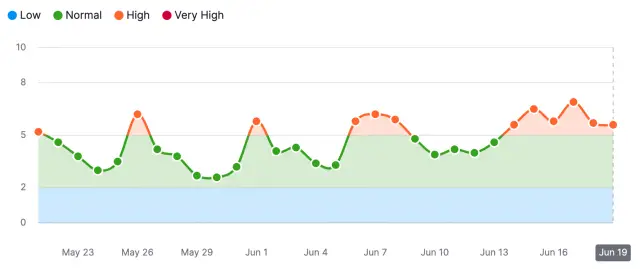
Since the 14th, the Google search tracking tools have been hotter than ever, and the SEO community is buzzing with excitement. Barry Schwartz of Search Engine Roundtable even said “I don’t think I’ve seen a period thing long with such heated volatility, with no confirmed update.”
You can especially see a big leap in volatility on this MozCast graph on June 20.

Newsletters during a slow economy
Publishers facing pressure in today’s digital landscape can find solace in a growing trend: newsletters. By embracing newsletters, publishers are witnessing audience growth and increased ad revenues.
Newsletter subscribers are highly engaged, attracting advertisers seeking impactful connections. Moreover, newsletters foster loyalty by enticing readers to consume more content and explore further. They also provide valuable first-party data and facilitate community interactions on publishers’ websites.
Amid challenging times, publishers seeking revenue diversification should seriously consider newsletters. With their ability to drive engagement and generate revenue, newsletters present a promising avenue for success. While the future of subscriber growth remains uncertain, embracing newsletters as a strategic move can prove beneficial in the year ahead.
EU’s new bill raises new transparency concerns for generative AI
Lawmakers in Europe have approved the EU’s Artificial Intelligence Act, marking the first formal regulation of artificial intelligence. This significant legislation could serve as a blueprint for policymakers worldwide grappling with the need to establish guidelines for this rapidly evolving technology.
The bill includes new transparency requirements for generative AI, such as publishing summaries of copyrighted material and implementing safeguards to prevent the generation of illegal content. The regulation aims to give publishers more control over their content and addresses concerns over fair use, potential loss of traffic, and revenue.
While the final version of the law is not expected until later this year, it adopts a risk-based approach, categorizing AI systems into different risk levels. Companies will need to disclose information about their AI systems and undergo risk assessments before making them widely available. Non-compliance could result in hefty fines or product withdrawal from the market.
In the United States, Senator Chuck Schumer is working on an AI framework and plans to introduce legislation in the near future. The U.S. Copyright Office is also seeking input on incorporating AI rules into existing copyright laws.
While the EU’s AI Act represents a significant step, experts are still evaluating its effectiveness in holding tech companies accountable and addressing the potential harmful effects of AI. Continued discussions and guidance from Congress and regulatory bodies are expected to shape the U.S. approach to AI regulation.
EU antitrust charges could lead to the breakup of Google’s ad business
The European Commission has charged Google with violating antitrust laws and suggested that the search engine may be required to sell part of its ad business as a solution. This potential divestment could reshape the digital marketing landscape, fostering a more competitive market, fairer pricing, increased transparency, and innovation in ad tools.
Following an investigation into Google Ads, the commission found evidence of preferential treatment towards the search engine’s own ads, creating challenges for competing providers. The commission deemed behavioral improvements insufficient and recommended divestment as the necessary course of action.
Google responded with a statement criticizing the commission’s findings, emphasizing the competitiveness and evolution of the ad tech industry and its contributions to merchants, consumers, and the availability of free, ad-supported content.
This is not the first time Google has faced antitrust allegations. Earlier this year, nine U.S. states filed a similar lawsuit against the company, accusing its ad business of antitrust violations. The case is ongoing, along with another antitrust case scheduled for trial in September 2023.
Beauty advertising down for H1 2023
While the economy experiences its ups and downs, the beauty industry continues to witness consumer demand. This phenomenon is known as the lipstick effect, a concept coined by Leonard Lauder, Chair of Estée Lauder, in the early 2000s, highlighting people’s tendency to invest in small indulgences, including beauty products, during such economic periods. Estée Lauder experienced double-digit profits during the 2007 recession, and Ulta Beauty has recently reported a significant growth in its Q4 earnings.

Despite consumer willingness to spend and the overall profitability of the beauty industry, some advertisers are scaling back their investments. This includes advertisers promoting hair care (down 16% to $208 million), oral hygiene (down 20% to $129 million), and bath & shower products (down 39% YoY to $71 million).
Overall, beauty advertisers reduced their spending by 9% YoY to $1.7 billion through April. In Q1, spending decreased by 6% YoY to $1.2 billion, with the most significant decline observed in March.

However, these reductions would have been more substantial if it weren’t for the increased budgets of advertisers focusing on skincare (up 10% to $554 million), cosmetics (up 1% to $242 million), and deodorant (up 20% to $107 million), collectively boosting their investments by 8% YoY to reach $908 million.

The reasons behind these divergent spending patterns are yet to be fully understood. Some beauty advertisers may be displaying hesitation, while larger factors might be at play. Time will reveal the truth, but this could mark the beginning of a new era for beauty advertisers, one that embraces younger generations with open arms.
While overall beauty advertising has experienced a decline, it is important to note that the industry is still thriving. Some advertisers have reduced spending despite launching new product lines.
Nevertheless, traditional tactics like in-store displays and demos will not be entirely abandoned. The lines between physical and digital experiences are blurring, and businesses must cater to both adequately. This will have a significant impact on advertising strategies moving forward.
H2 2023 advertising predictions
According to ad spending data through April 2023, 145,000 advertisers spent $44 billion across digital, print, and TV media, showing a 7% year-over-year decrease from 2022. Meanwhile, retail media is projected to reach a market value of $45 billion this year and is expected to grow by an additional $10 billion in 2024.
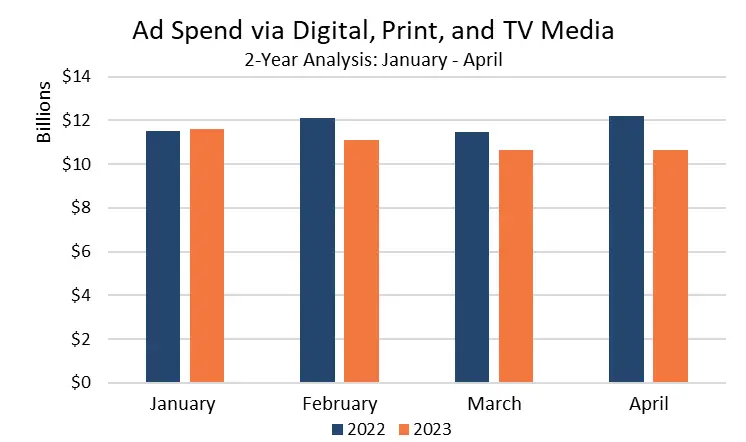
The impact of uncertainty varied among advertisers and their budgets in 2022. Despite recession concerns, airline advertisers increased spending by 138% year-over-year, amounting to over $422 million. Conversely, pet advertisers scaled back their investments, even though many people adopted pets during the pandemic. Such variability is likely to persist in the second half of 2023.
In the period leading up to film premieres in H1 2023, advertisers promoting movies such as “Ant-Man and the Wasp: Quantumania,” “Guardians of the Galaxy Vol. 3,” and “Knock at the Cabin” increased their budgets.

Travel advertisers are continuing to increase in spending, with an overall increase of 6% year-over-year. This growth is observed in lodging, cruise lines, and U.S. tourism bureaus, indicating that despite inflation and a looming recession, travel remains a priority for many Americans.
On the other hand, advertisers in several categories reduced their spending. This includes advertisers promoting software, colleges and universities, big box stores, professional services, and beauty products. For example, finance and business software advertising saw a decline of 10% and 22% year-over-year, respectively, while colleges and universities reduced their spending by 13% to $397 million. The decrease in education advertising could be attributed to seasonal factors or the rising cost of tuition leading to lower enrollment rates.

Meta and Google have long dominated the digital advertising landscape, with limited competition. However, the rise of AI, specifically ChatGPT, is posing a new challenge for these giants. As consumers increasingly rely on AI for queries and recommendations, Google may gradually lose its stronghold on search and the associated ad dollars. Advertisers will follow consumer behavior and allocate their budgets accordingly.
Google is already testing generative AI in search, introducing changes to the platform’s user experience, e-commerce features, and advertising. Google’s AI-powered search leverages the Google Shopping Graph to provide recent reviews, ratings, prices, and product images to inform purchase decisions. Nevertheless, it is evident that Google’s dominance is waning, and advertisers may explore other ecosystems until Google adapts to this new landscape.
Amazon and other retail media networks are expected to reap the benefits of the evolving advertising landscape. Similarly, Facebook, particularly among advertisers catering to small-to-medium businesses (SMBs), is poised to thrive as these businesses gravitate towards the well-established social media platform. In fact, in the period up to April, approximately 26,000 companies invested in advertising on Facebook, with 91% (23,000) allocating budgets of less than $25,000.
A changing ecosystem
Digital publishing is seeing some major shifts in its structure while also feeling the burden of stagnant ad rates. With generative AI tacked on top of it all, it can be overwhelming. We’ll be back in two weeks to give you more updates!
PUBLISHED 6/6/23 at 12:30PM
You asked and we heard you! We are back to giving you updates on the digital publishing industry and ad rates every other week.
The world of content creation is rapidly changing with the continual development and emergence of artificial intelligence. If this has you biting your nails, we have a special webinar on Wednesday, June 7 at 9:00am PDT/12:00pm EDT on AI & the Web – Apocalypse or Opportunity, hosted by Ezoic CMO Tyler Bishop.
Before we dive into what’s happening now, let’s recap Q1 2023. Or, you can skip the recap and get straight to what’s been going on in Q2 2023.
What happened in digital publishing in Q1 2023?
Below this update, you can find our bimonthly updates from Q1 but if that is TL;DR, I’ll sum it up right now.
Entering into January 2023, there was still hesitancy in the market due to the uncertain state of the economy; almost 30% of major advertisers had plans to cut their ad budgets in 2023 and US ad rates were down 22% compared to the same period last year. A forecast for US ad spending in 2023 indicated a decrease of $5.51 billion from the original projections for 2023.
In general, ad rates were pretty stagnant throughout Q1, with a small increase in the middle of February.
During such unpredictable times, it is essential to closely monitor ad spend trends in your niche. Certain niches performed better depending on holidays, social trends, and previous spending (i.e. non-alcoholic beverages increased in ‘Dry January’ and candy increased around Valentine’s Day). If there is a real winner in Q1 2023 for ad dollars, it’s the travel industry; overall, the travel industry has shown substantial growth this year, driven by a combination of the booking curve and an increase in remote work, allowing people to travel while continuing their jobs. Airlines and other travel categories are ultimately aiming to recover from the losses incurred during the pandemic.
Google and Silicon Valley Bank news from Q1 2023
In Google news, there was the Google March 2023 broad core update that rolled out in March. Google emphasizes that core updates are not penalties but rather improvements in assessing content.

As you can see from MozCast’s 90-day forecast that shows changes in the Google algorithm, May was full of bumpy days.
Additionally, Google was sued by the Department of Justice at the end of January for antitrust, which had some advertisers reconsidering their relationship with the company (although complete abandonment is still unlikely). Regardless, the open programmatic market is undergoing changes, with some agencies moving towards curated marketplaces to ensure higher-quality inventory. Brand safety has become a top concern for brands in 2023, with a focus on ensuring their ads appear on high-quality sites and align with positive values.
Q1 also saw the collapse of Silicon Valley Bank in March, which held accounts for startups like Buzzfeed and Roku. The bank was taken over by the FDIC due to clients withdrawing money and the devaluation of government bonds. This event created a lack of confidence in the market.
Elon Musk’s acquisition of Twitter and the subsequent changes he implemented led to a decline in Twitter traffic referrals to some publishers’ websites in Q1. However, TikTok saw an increase in ad revenue, defying the general advertising slowdown. It has become a significant player despite threats of it being banned in the US, occupying about 25% of social ad budgets and growing 50% year-over-year since 2020.
Short-form video increases in popularity in Q1 2023
YouTube’s attempt to generate revenue through YouTube Shorts has not gone as planned. The revenue share for creators is less favorable compared to other platforms, and the introduction of ads has led to a decline in watch time and revenue, despite increased impressions and views. Overall, Shorts has not gained nearly the same popularity as TikTok.
Video ads, particularly short-form and personalized ones, are on the rise, as consumers show a preference for video content before making purchases. Amazon is also focusing on AI-generated video ads to enhance its digital advertising efforts.
The Interactive Advertising Bureau proposed a new classification for instream video ads, which could impact buyers and sellers. The proposal suggests dividing instream ads into primary instream (requires viewer interaction) and accompanying instream (played automatically with sound off). This could have implications for creators, as instream ads make up the majority of video advertising on platforms like YouTube, Facebook Watch, and Snapchat Shows.
To stay relevant in digital publishing, it is essential for publishers to connect with younger audiences, particularly Gen Z and young Millennials. Platforms like TikTok and YouTube are effective in attracting younger readers, with short-form video content being the preferred format. Understanding the preferences of younger generations and adapting content accordingly will help publishers maintain traffic and revenue.
The rise of generative AI in Q1 2023
The rise of AI chatbots, such as Microsoft’s ChatGPT and Google’s Bard, is another notable development. These chatbots are integrated with search and may impact publishers’ revenue and traffic. However, the need for quality, informative content remains, as chatbots excel at providing basic information but lack the creativity and originality of human-created content.
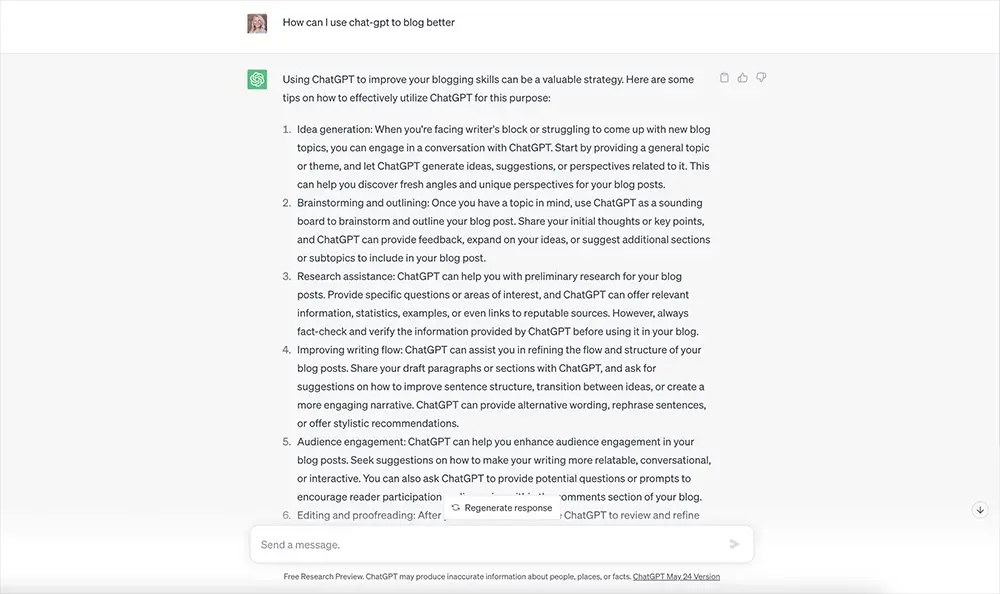
While ad rates may not be as high as anticipated, advertisers are still spending, albeit more selectively. Publishers who stay informed about industry trends, such as AI and video content, are likely to succeed. The key to improving ad revenue in 2023 is prioritizing quality over quantity, embracing dynamic ad placements, and recognizing the importance of content.
What is happening so far in Q2 2023?
A lot has changed so far in Q2 2023—Big Tech has been hit with some lawsuits and drops in revenue, and there have been fluctuating ad rates, significant changes in generative AI, and updated SEO processes. Below, I’ll cover the major news updates from Q2 so far.
Ad rates and trends in Q2 2023
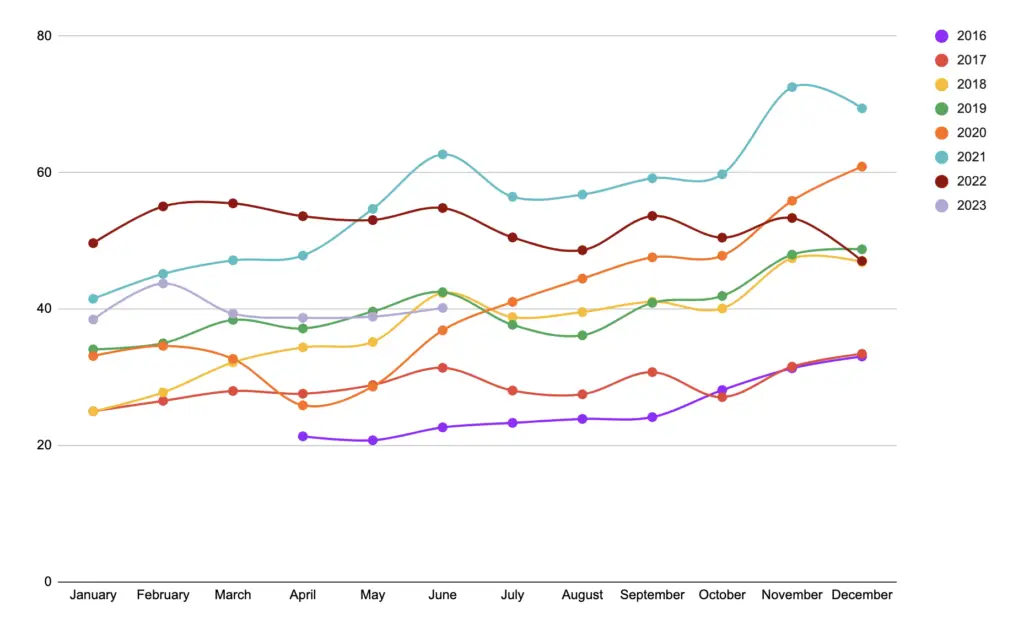
We have been keeping track of ad rates here at Ezoic through the Ad Revenue Index since April 2016.
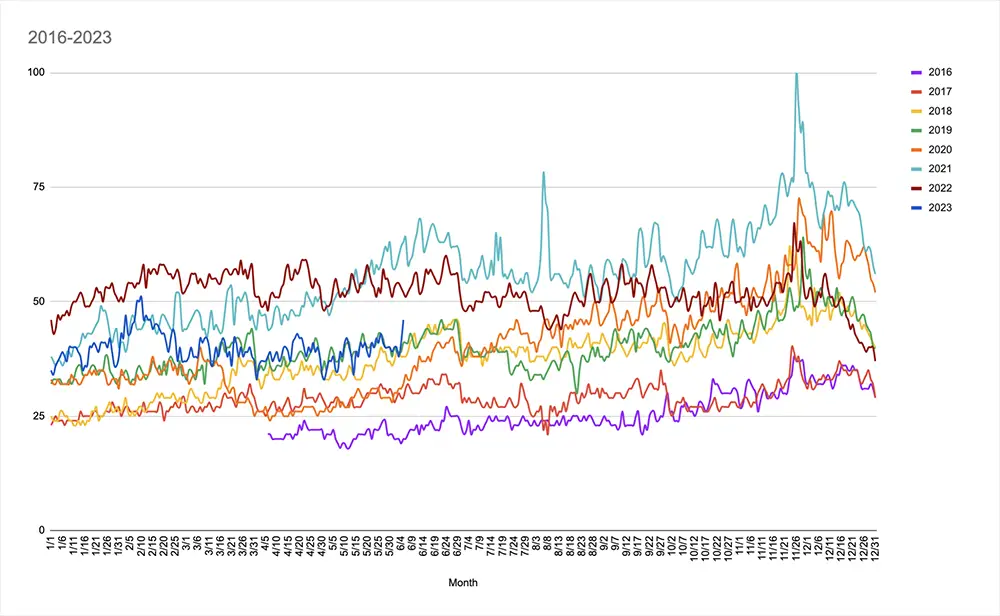
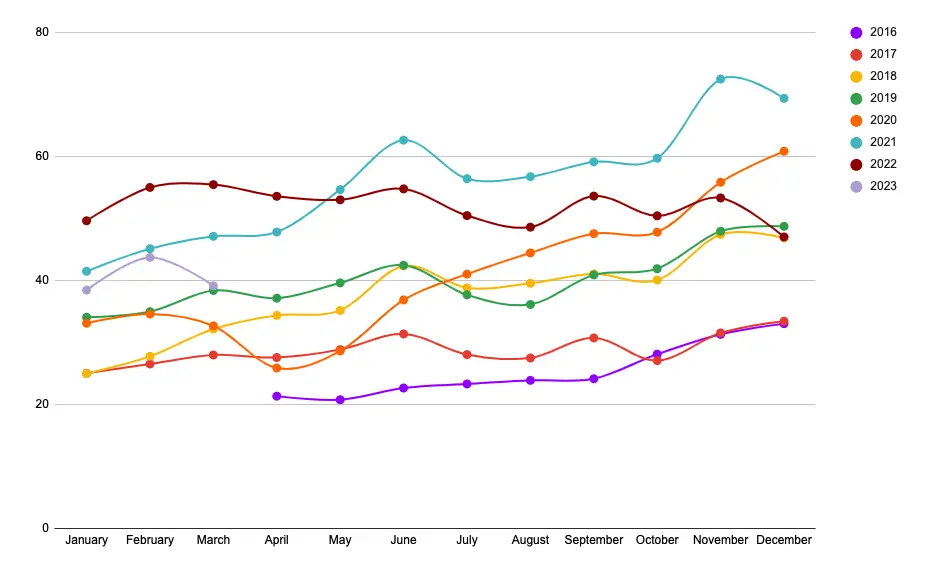
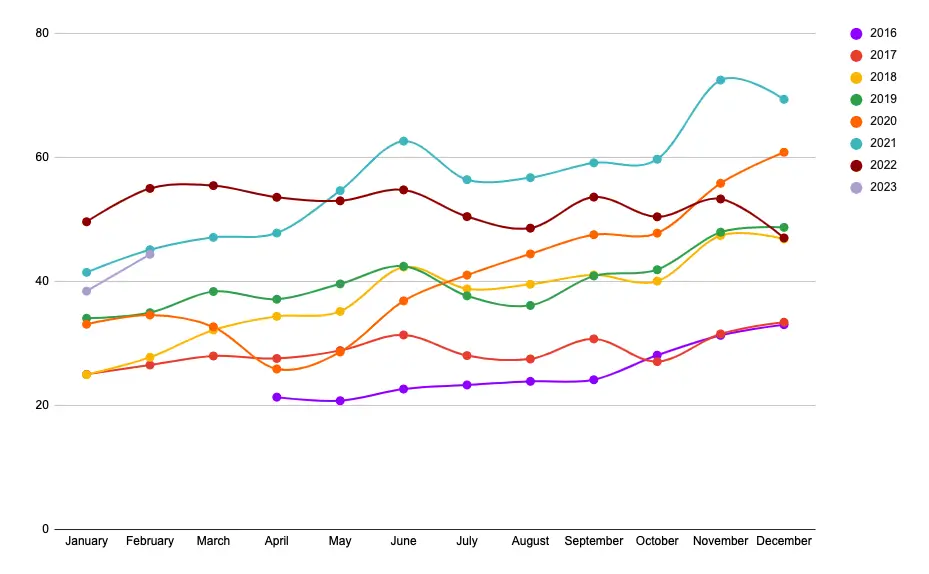
As shown, ad rates are roughly what they were the year before the pandemic. When you add in inflation, however, this means publishers are likely not getting as much bang for their buck. As shown, 2021 started off strong and continued to mostly grow after the end of 2020 saw a surge in ad rates. Overall, 2022 was relatively stagnant until about halfway through the year, where then ad rates began trending downwards.
Now, nearly halfway through 2023, ad rates are looking nothing like the previous two or three years. However, I’ve mentioned it once and I’ll mention it again—those soaring ad rates in 2020-2022 were a direct result of the reaction to the pandemic, not an indication of where ad rates were going. Though the pendulum has maybe swung too far the other way, ad rates will eventually level themselves out as the economy stabilizes (or if the economy stabilizes, but that’s for another day).
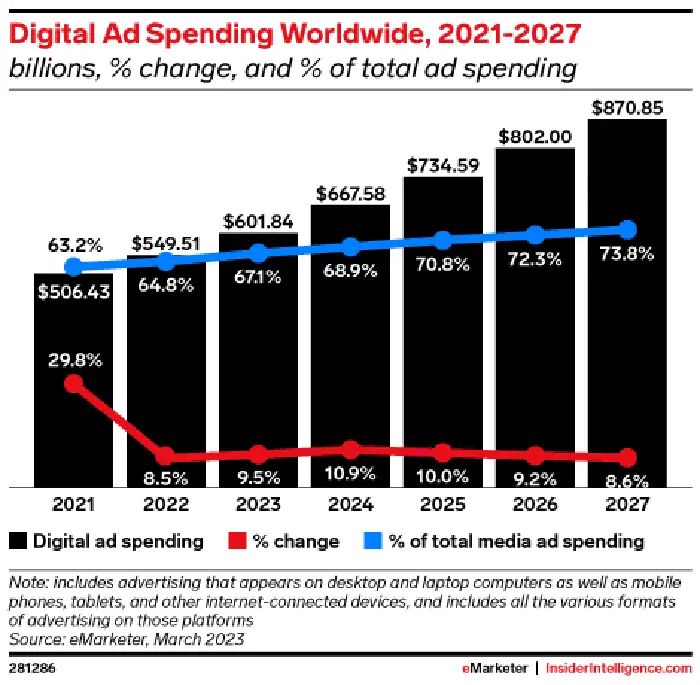
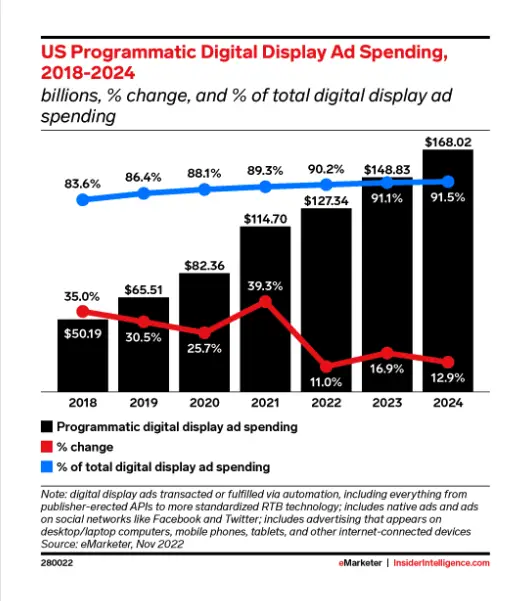
Digital ad spend is still growing YoY, though the rate at which it is growing has slowed down. In 2022, the percent change dropped from 29.8% in 2021 to 8.5%. From there, it is projected to slowly peak at 10.9% in 2024 and then slightly decrease over the next few years.
According to Dentsu’s global forecast, while advertising spend is expected to grow despite economic uncertainty, media price inflation is a significant driver of the increase, and 2023 is projected to be a relatively flat year for ad spend.
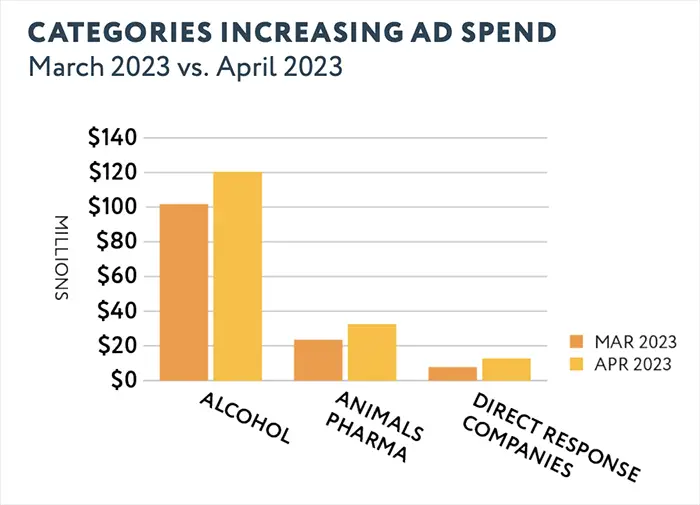
MediaRadar recently released its April 2023 numbers on ad rates. In April 2023, there was a 12% YoY decrease in ad spend, which is likely a result of the market stabilizing after the pandemic. Compared to March of the same year, ad spend was 1% lower. This suggests that advertisers are still investing but being cautious with their budgets in the current economic climate. However, there were MoM increases in ad spending from categories such as Beer, Wine & Spirits, Animal Pharmaceutical, and Direct Response advertisers, indicating some areas of growth in advertising.
Alcohol advertising experienced a significant increase of 18% month-over-month (MoM), surpassing $120 million in April 2023. Animal pharmaceuticals also saw a 14% MoM increase in ad spend in April 2023. The growth was primarily driven by dog pharmaceuticals, including flea and tick preventatives, heartworm medications, and deworming medications. Direct response companies experienced a remarkable MoM increase of over 60% to nearly $13 million in April 2023. The surge in ad spend was largely driven by jewelry direct response companies. Apparel and accessories direct response companies also increased their ad spend to over $4 million.
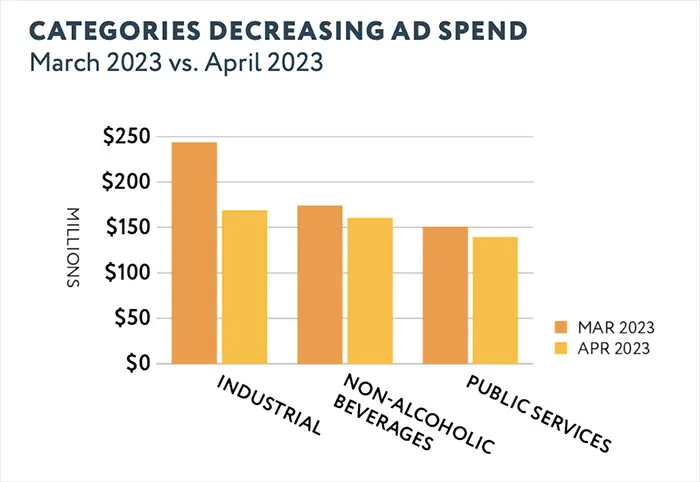
In April 2023, the biggest month-over-month decreases in ad spend were observed in the Industrial (-21% MoM), Non-Alcoholic Beverages (-6% MoM), and Public Services (-23% MoM) categories.
Industrial companies invested $169 million in advertising during April, which was over one-third less than in March. Non-Alcoholic Beverages advertising decreased to $161 million in April 2023 and Public Service ad investment decreased to $139 million; one driver of this reduction was ad spending for political public services, including national security advertising for military branches, among others, which decreased by 68% MoM to $5 million. Another driver was religious public services advertising, which decreased by 15% MoM to $11.4 million.
Big Tech Q2 2023 news
A lawsuit was filed against Google in the UK in April, alleging that the company has abused its dominance in display advertising since 2014. The lawsuit seeks £3.4 billion ($4.2 billion) in damages. It accuses Google of breaching competition law by giving preferential treatment to its own ad tech products, which has resulted in increased market-wide prices for ad tech services and lower compensation for publishers.
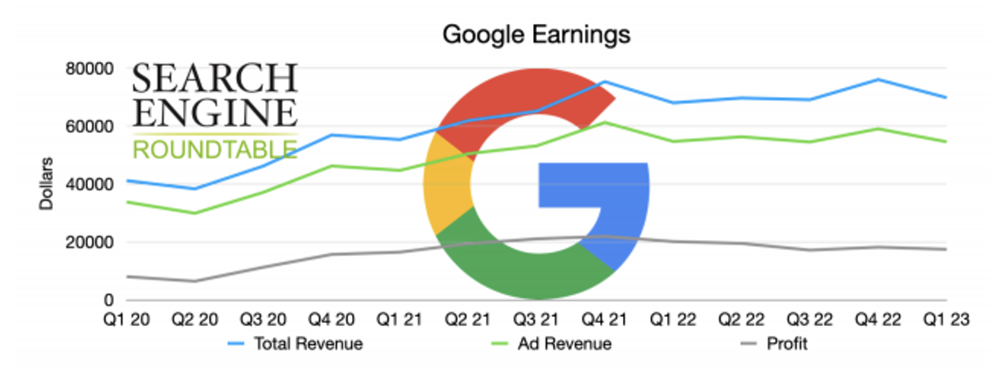
In Google’s Q1 earnings report at the end of April, advertising revenue showed resilience, with a flat or slight decrease of 0.21% in the most recent quarter, beating Wall Street estimates. Overall revenue increased by 3% year-over-year, but profit was down approximately 8.5%. In contrast, Microsoft reported a 10% increase in search and news advertising revenue, excluding traffic acquisition costs, which remained flat compared to the previous quarter.
In May, Google also introduced a new policy requiring European-based publishers using its monetization tools to exclusively work with consent management platforms (CMPs) that comply with the Transparency Consent Framework (TCF), a standardized privacy protocol developed by an IAB Europe-led coalition. The update applies to publishers in the European Economic Area and the UK who want to use tools like Google AdSense, Ad Manager, or AdMob.
In Q1 2023, YouTube witnessed a 28% year-over-year increase in ad spending, with advertisers in industries such as Media & Entertainment, Technology, Medical & Pharmaceutical, Finance, and Food investing $5.7 billion on the platform. The rebound comes after YouTube experienced a drop in ad revenue in Q3 2022 due to budget constraints by advertisers amidst economic uncertainty. However, YouTube’s ad revenue still reached nearly $30 billion in 2022.

Meta has experienced some trouble this quarter. At the end of April, multiple advertisers on Meta platforms noticed that their ad accounts had spent up to four times their daily budget within a few hours, resulting in significantly higher costs per acquisition (CPA). Meta attributed the problem to an automated system and mentioned implementing measures to prevent such incidents in the future.
Additionally, Meta was fined a record $1.3 billion by the European Union (EU) for violating data transfer laws. The company transferred the data of EU citizens to the United States, breaching the EU’s General Data Protection Regulation (GDPR). Meta has been given five months to halt future transfers of personal data to the U.S. and six months to cease unlawful processing and storage of EU/EEA users’ data in the U.S.
The consequences of the ruling would have significant implications for any company involved in data transfers between the EU and the U.S. Meta accounts for more than 50% of all GDPR fines, accumulating $2.5 billion in penalties. The company has been fined seven times, with four of the fines imposed in 2022. It is important to note that this ruling specifically applies to Facebook and not other platforms owned by Meta, such as Instagram.
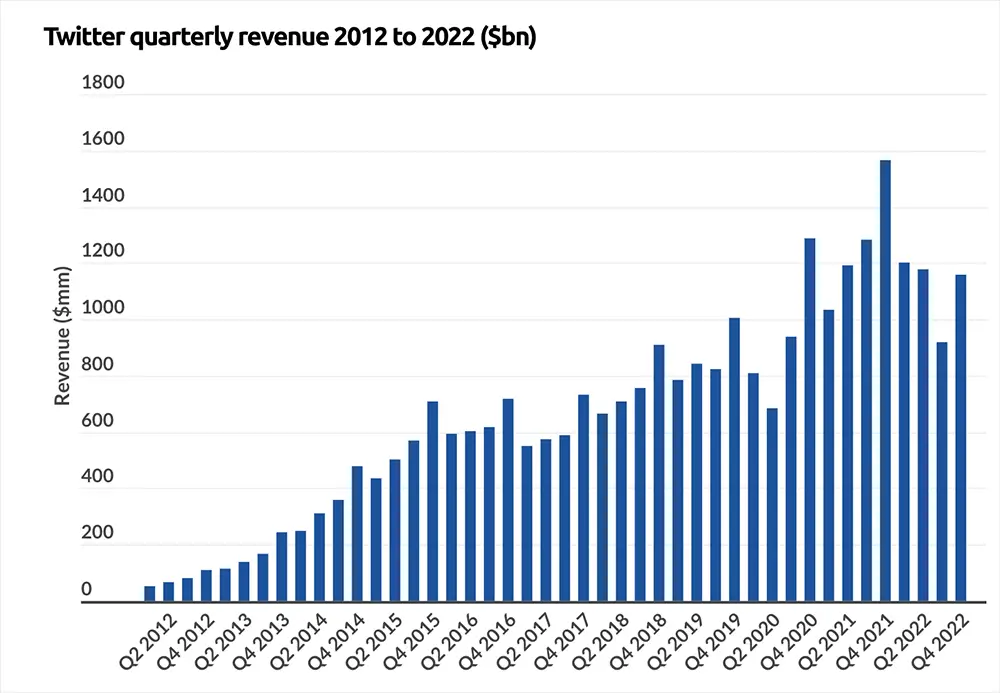
Twitter revenue has declined by 59% YoY, according to an internal presentation obtained by The New York Times. Twitter’s U.S. advertising revenue during the five weeks from April 1 to the first week of May was $88 million, falling short of weekly sales forecasts by as much as 30%. Advertisers have been concerned about an increase in hate speech, explicit content, and ads related to online gambling and marijuana products. The internal document suggests that Twitter’s U.S. ad revenue is projected to decline by at least 56% each week compared to the previous year. Advertising is crucial for Twitter, accounting for 90% of its revenue.
Lastly, the popularity of TikTok among Gen Z has led to a widespread shift towards vertical video in the industry, even though there is a political movement to ban the app due to concerns with China collecting data; Montana became the first state to block it in May. Alongside YouTube, Facebook, Instagram, and Snapchat, publishers are now racing to create and monetize more vertical video content.
Artificial intelligence in digital publishing progression in Q2 2023
The evolution of AI is changing the way content is created and generated. While some may fear that AI will replace writers, it should be seen as a tool to enhance and elevate human creativity. AI can help create content faster, but it won’t magically improve mediocre writing. However, for skilled writers, AI tools can enhance their abilities and improve content creation speed.
In April, Google revealed it is working on building an all-new search engine powered by its new AI technology, aiming to provide users with a more personalized experience and anticipate their needs. It is designed to learn from users’ search behavior and offer preselected options for purchasing and researching information, with a more conversational interface. In parallel, Google is also working on Project Magi, which involves adding new features to the existing Google Search.
Google followed up in May on its AI projects at Google I/O, its annual developer meeting. The company aims to make the search engine more visual, personalized, and appealing to younger users. Google plans to move away from the traditional “ten blue links” format and introduce a more engaging and interactive interface. There are indications that conversations with the search engine will be possible. Additionally, Project Magi aims to enhance the search experience by enabling users to complete transactions and even answer coding-related queries. Google has since released a test version of its new search engine to those on the waitlist.
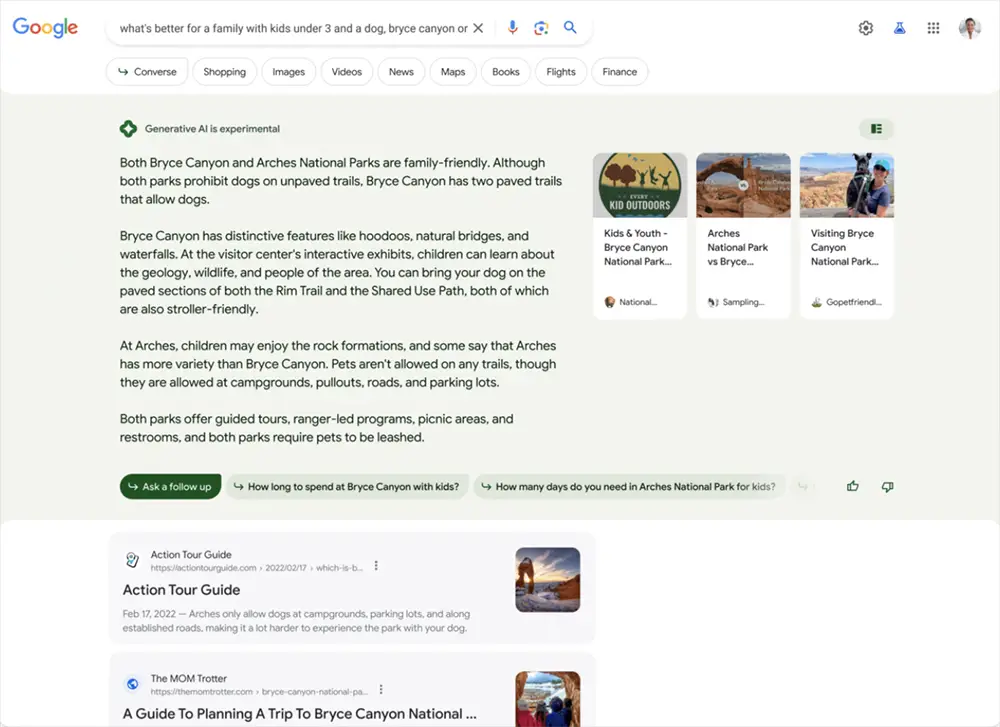
There is concern about the impact of the new Google Search Generative Experience on traffic to content creators, publishers, site owners, and the web in general. However, the concern may be overblown due to Google’s reliance on ad revenues, which account for about 80% of its overall revenues. Google primarily earns money from clicks on ads, and the last earnings report showed an increase in paid clicks but a decrease in cost-per-click. This means that Google needs users to click on ads to maintain its revenue stream. Therefore, it is unlikely that Google would design a search interface that discourages users from clicking on both paid and organic listings.
Google announced an improvement in its citation display in mid-May by adding numbers alongside the response text, which, when clicked, reveals the corresponding source and provides a link to it. This feature aims to make it easier for users to identify and navigate to the parts of the response that match the source. Additionally, Google stated that Bard has been enhanced with better summarization capabilities, leveraging advancements in their large language models. These improvements are intended to make it easier for users to quickly grasp the main points of a topic.
However, some users have noticed that some of the linked sources are no longer accessible, leading to 404 errors or parked domains. In comparison, Bing Chat is considered better in terms of citation accuracy.
Microsoft announced it will be integrating ChatGPT into its Bing search engine for advertising purposes. Microsoft sought to assure content creators that the goal of the new Bing is to drive more traffic and revenue to publishers. Microsoft aims to prioritize searchers’ needs by offering chat, answers, and content creation capabilities in one experience.
Mikhail Parakhin, CEO of Bing at Microsoft, stated that Google Bard utilizes a “much smaller model” compared to Bing Chat. This remark came in response to a comment praising Bard for its speed in comparison to Bing Chat. Parakhin confirmed the speed advantage of Bard and attributed it to the use of a smaller model by Google.
There is growing concern about the development of AI systems more powerful than GPT-4, with over 27,000 people signing a petition to pause their development. The question now revolves around whether the United States government should regulate AI, potentially considering if it is already too late.
The White House has initiated efforts to foster responsible innovation in AI, protect citizens’ rights, and ensure safety. They have met with AI leaders to discuss responsible and ethical innovation and address national security concerns related to AI cybersecurity and biosecurity.
An Oversight of AI hearing was conducted by the Subcommittee on Privacy, Technology, and the Law to explore AI regulation in mid-May. IBM proposed a precision regulation approach, focusing on specific use-case rules, while OpenAI’s CEO expressed commitment to safety and discussed the potential economic effects of AI on the labor market.
Concerns were raised about the potential misuse of powerful language models like GPT-4, highlighting risks such as fabricating false narratives, promoting baseless accusations, and providing harmful advice. Calls for tighter collaboration between independent scientists, tech companies, and governments were made to ensure the safety and responsible use of AI technology.
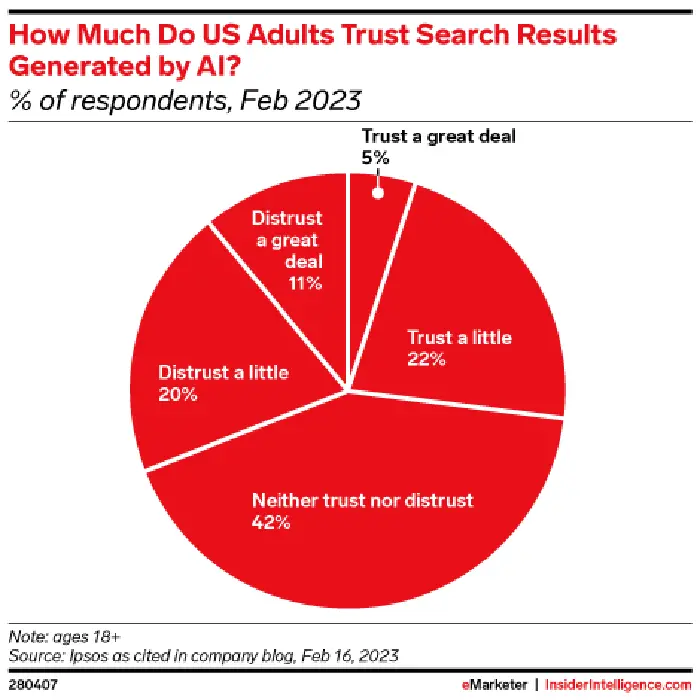
What does the layperson think of all this? As reported by eMarketer, US adults haven’t quite warmed up to search results generated by AI.
SEO updates from Google in Q2 2023
Google updated its documented ranking systems page, removing four ranking systems: page experience, mobile-friendly ranking, page speed, and secure sites. This raises questions about the significance of these systems in Google’s search ranking algorithms in the first place. While Google stated that page experience signals align with search ranking success, it clarified that these signals are not directly used to inform ranking. The “page experience update” was described as a concept highlighting key aspects for site owners to focus on, rather than a separate ranking system. The removal of these systems may indicate that they had minimal impact on rankings. The change was made to prevent people from hyper-focusing on these metrics, suggesting it was not a productive use of time and energy.
Google also reiterated that while there is no specific E-A-T (Expertise, Authoritativeness, Trustworthiness) algorithm, it does consider factors and signals that align with the values associated with E-A-T when determining content quality. Google’s systems aim to identify and prioritize helpful content based on a mix of factors that demonstrate experience, expertise, authoritativeness, and trustworthiness. While E-A-T itself is not a specific ranking factor, content that aligns with strong E-A-T is given more weight, particularly for topics that significantly impact health, finance, safety, or society’s welfare. Optimizing directly for E-A-T is not possible, but creating content that embodies these qualities should be recognized and rewarded by Google. It is a combination of multiple signals that Google uses to assess E-A-T in content.
Wrapping up Q2 2023 news
That was a lot of information to digest, but the digital advertising space is rapidly changing. If the above was also TL;DR, here is a quick rundown of everything that has happened in Q2 2023 so far.
- Ad rates are pretty stagnant this year so far and it’s unlikely to get much better until the economy is more stable.
- While Google’s overall revenue increased by 3% YoY, profit was down 8.5%. Microsoft is up 10% for search and news advertising revenue.
- Big Tech is experiencing fines for dominance abuse and violating data transfer laws.
- AI is rapidly changing the game—while Microsoft’s Chat-GPT is still deemed the best, Google’s Bard is continually being improved. Additionally, Google released a test version of the new Google Search Generative Experience that users can join the waitlist for. Microsoft will be integrating ChatGPT into its Bing search engine for advertising purposes. There are growing concerns about the power of AI and questions about if AI should be regulated.
- Google dropped its ranking systems of page experience, mobile-friendly ranking, page speed, and secure sites. Google also doubled down on how there is no E-E-A-T specific algorithm but uses it to help determine content quality.
See you again in two weeks!
PUBLISHED 3/31/23 at 8:30AM
Welcome to the final installment of Q4 2022/Q1 2023 ad rates.
Ad rates are still lower than that of 2021 and 2022, but as we have discussed before in this blog, those were not typical years—there were a lot of businesses trying to recoup their losses from 2020, causing ad rates to soar.
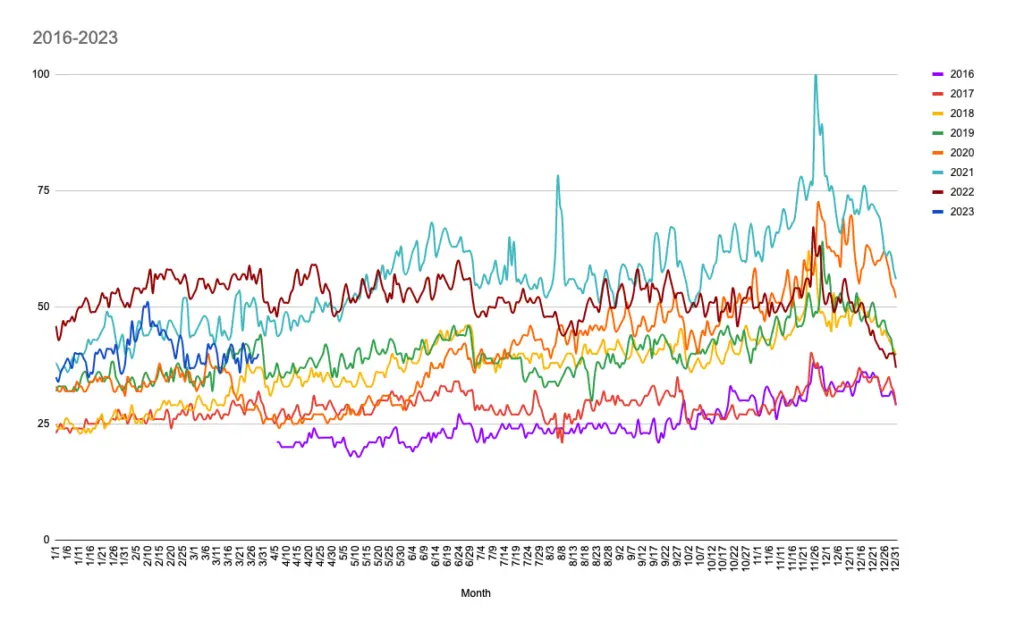
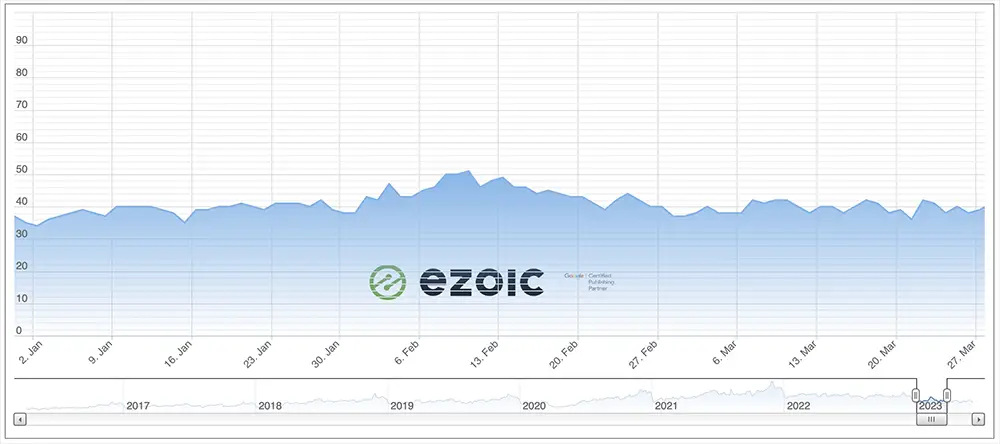
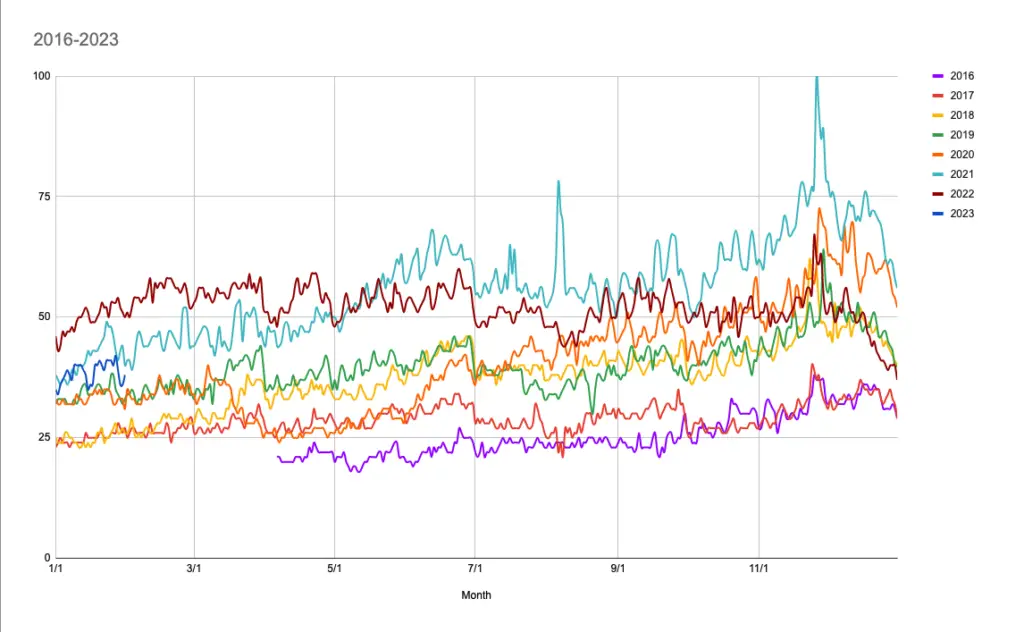
This graph shows ad rates day over day since Ezoic first published the Ad Revenue Index in April 2016.
They have since come down as businesses prepare for a possible coming recession and are more on par with ad rates from 2019, before the pandemic. While inflation means ad rates are still lower than what the average “should be,” they are only drastically low when compared to 2021 and 2022.
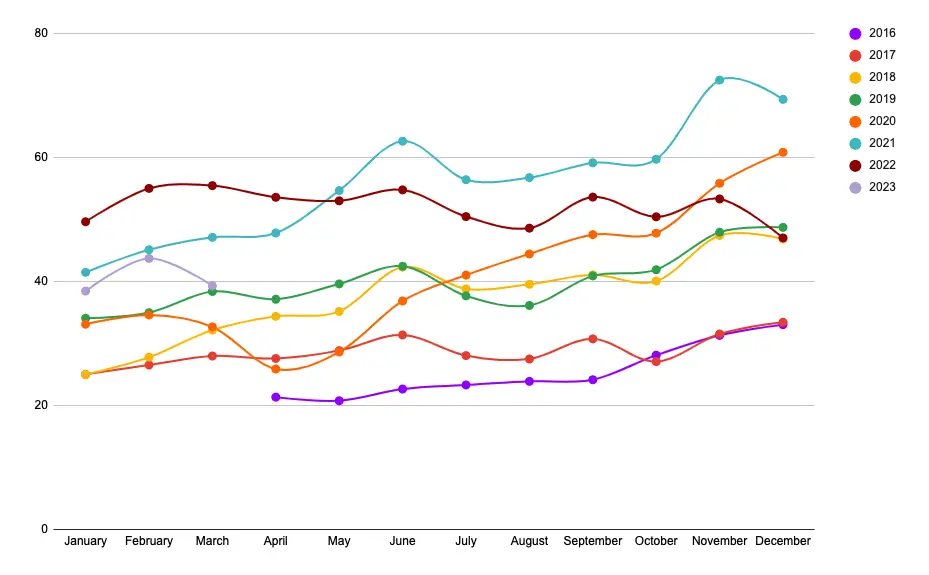
Ad rates, on average per month, show that the average ad rate for March is lower than February.
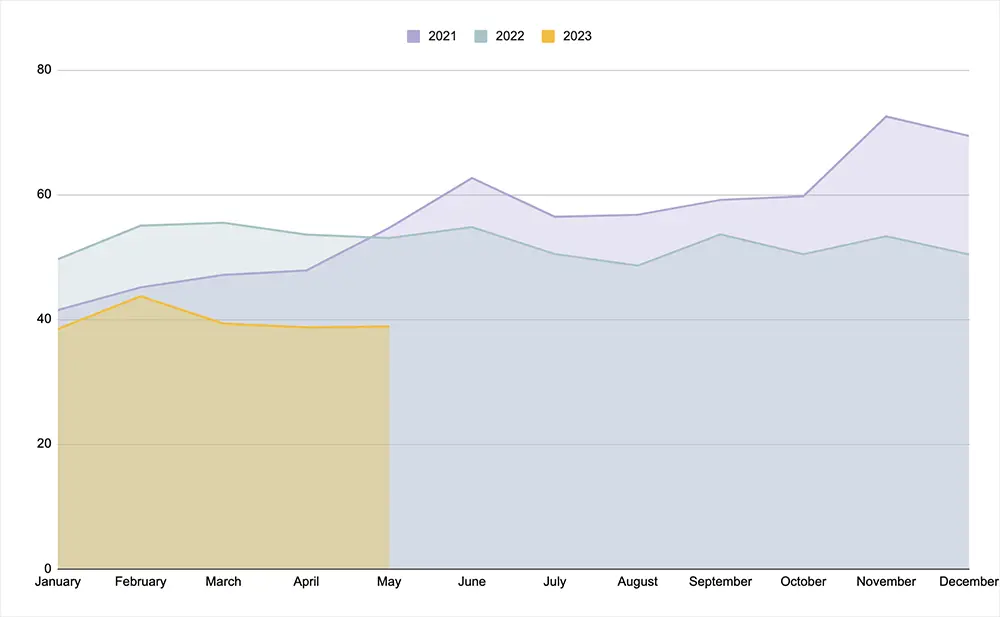
Looking at average monthly ad rates this March compared to March 2021 and 2022, it is evident they are about 20 points lower.
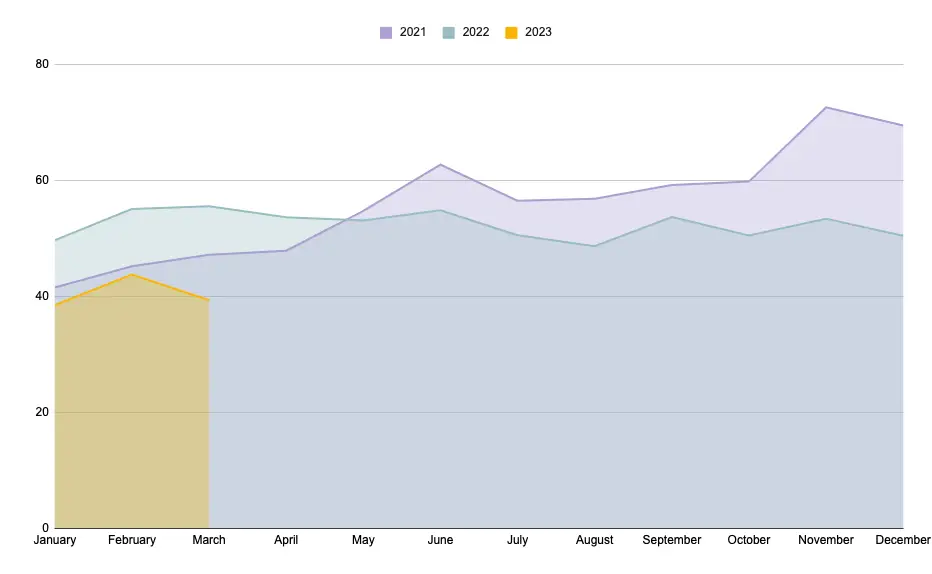
This graph looks at average ad rates per month since 2021. As stated, the years following the first year of the pandemic were unprecedented and were not necessarily the “new norm.”
Google March 2023 broad core update is finished rolling out
As discussed on our most recent podcast, the Google March 2023 broad core update completed rolling out earlier this week. Compare to the September 2022 update, it was only slightly more volatile.n The core update was a wide-sweeping, all-content, all-regions update that had a quick impact.
As you’ll hear on the podcast, we recommend looking at your data with a wide-angle lens rather than focusing in on the time period of the core update to determine if you were hit or not. We find that often, publishers think they were affected by a core update greatly when, in actuality, it was just a slight blip, and things returned to normal soon after. Or, it might be that on Wednesdays, a particular publisher always gets less traffic, and so a Wednesday during the core update with some volatility doesn’t actually mean the site was affected by the core update.
What should you do if you suspect you were hit by the algorithm? Google says to do nothing:
“There’s nothing wrong with pages that may perform less well in a core update. They haven’t violated our webmaster guidelines nor been subjected to a manual or algorithmic action, as can happen to pages that do violate those guidelines. In fact, there’s nothing in a core update that targets specific pages or sites. Instead, the changes are about improving how our systems assess content overall. These changes may cause some pages that were previously under-rewarded to do better.”
Basically, you’re not being penalized; Google is just being optimized to better give search results to users. It may even be that you were ranking for something that one of your particular pages didn’t cover that well; a core update might catch this and provide the user with a different page that has better information. It could be the tiniest differentiator that was updated and there is no way to know.
The only thing you can do is make your content better—this could mean going through older articles and updating outdated content, using your analytics to see keyword opportunities, or using something like Ezoic’s NicheIQ to find topic suggestions.
Bing Chat set to feature ads, may share ad revenue with publishers
Currently, there are over 100 million daily active users on Bing and over 100 million chats recorded. What’s interesting is that one-third of users are new users of Bing.
As generative AI has grown in popularity this year, Microsoft has been working on ways to continue to support publishers. As of late, this includes chat answer citations linked to sources and “learn more” links.
Where ads within the chat come into play is that Microsoft is looking at ways to distribute content, improving both traffic and revenue for publishers. This includes ads in the chat, in which publishers whose content contributed to the chat would share in the revenue; including more links from a publisher if a user hovers over a publisher’s link in the chat; and implementing a rich caption of Microsoft Start licensed content beside chat answers.
Generative AI is going to continue to be a growing part of digital publishing and it’s important to be aware of trends, including how it can best benefit you as a publisher. Shared revenue and linked sources to your content within Bing Chat is a step in that direction.
Ad spend trends for real estate and travel
Interest rates for a 30-year fixed mortgage currently come with a 7% interest rate; coupled with rising inflation, and you get lower real estate spending. Advertising for this market reflects how the market is doing.
Real estate advertisers spent 23% YoY less in 2022, equivalent to $2.3 billion on ads. While the beginning of 2022 showed a 10% YoY increase and home sales at their highest point since 2007, in April, it began to slow down, which was followed by an ad spend decrease.
So what about 2023? Inflation reached a 40-year high in 2022 and in February 2023, mortgage interest rates were at their highest since the end of 2022. With Silicon Valley Bank also closing, homebuying isn’t only at stake but also advertisers in the niche.
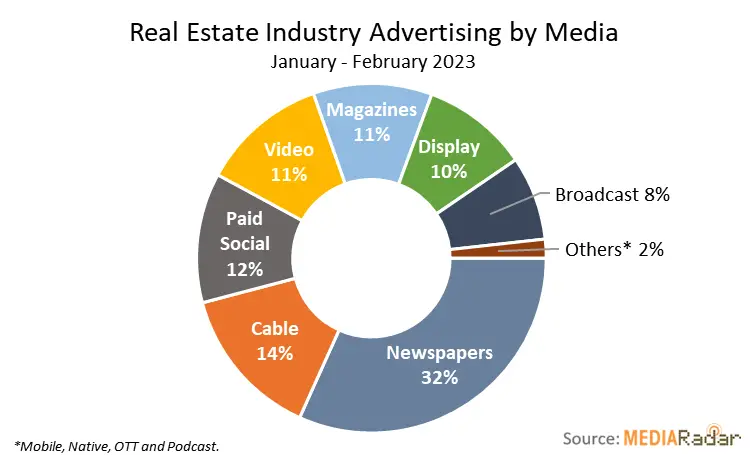
Even though the real estate market seems volatile, advertisers still spent $245 million in the first two months of 2023; newspapers saw the majority of the real estate ad spend (32%), followed by cable (14%), paid social (12%), video (11%), magazines (11%), display (10%), broadcast (8%), and other (2%).
While real estate may be down, the travel industry is seeing a rise in ad spend.
People are back to traveling like before the pandemic—maybe even more so, as a means of making up for lost time—and advertisers are spending a lot of money to try to earn back the trillions of dollars they lost during COVID-19.
Not surprisingly, ad spend increased 42% YoY in 2022, amounting to $4.6 billion in ad spend. The biggest increase was in Q1, with a rise of 107% YoY.
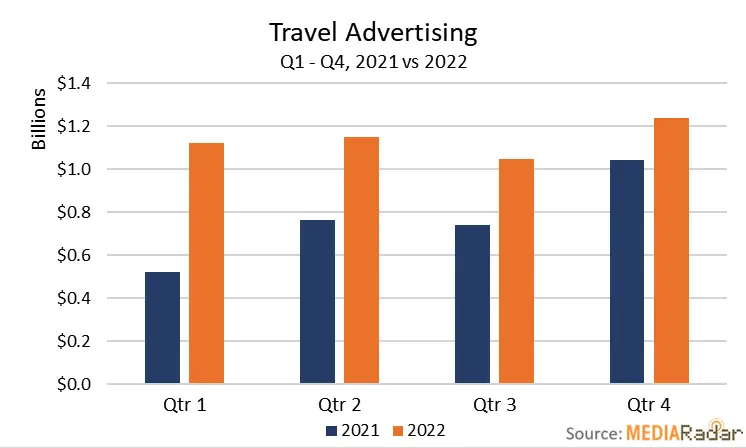
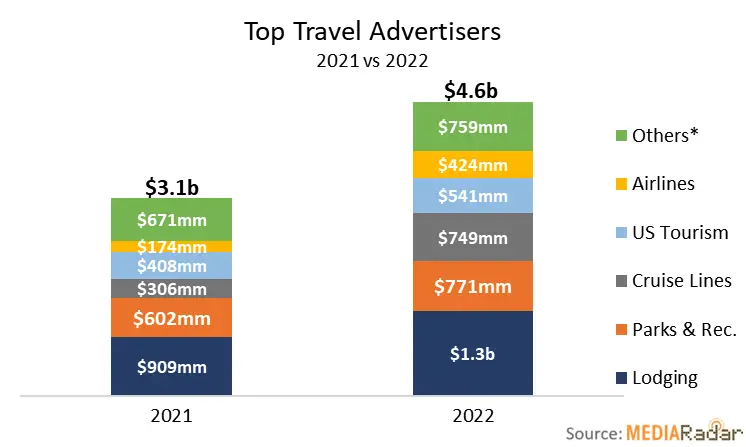
Lodging was the biggest spender at $1.3 billion, followed by parks and recreation, cruise lines, US tourism, airlines, and others. Airlines and cruises saw the biggest leaps from 2021 to 2022, however.
Looking back at travel advertising in 2022, it varied per vertical on where that ad money was spent. Airlines were the biggest spender in the display category, allotting 18% of their ad spend.
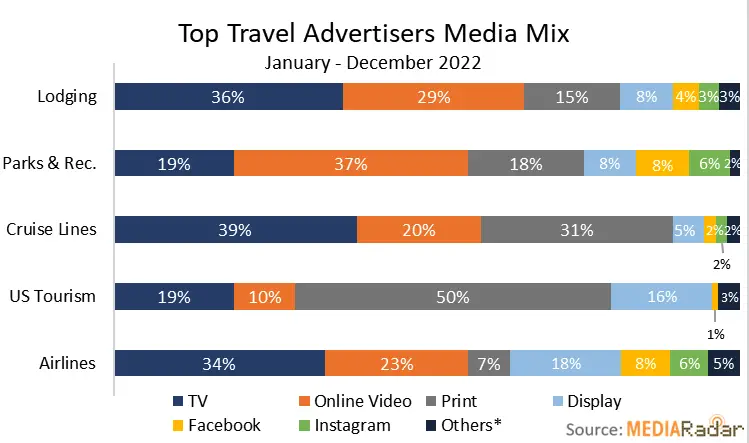
Looking at 2023, it has become evident that people are willing to spend their money on non-essentials, despite the economy. This includes things like travel and restaurants. Advertisers are following the consumer trend, having increased their ad spend by 23% YoY.
It’s expected ad spend on travel will continue to increase throughout 2023.
Publishers need to connect with younger audiences to stay relevant
Publishers who are able to allocate some time to figure out how to connect with Gen Z and younger Millennials are more likely to continue to succeed in digital publishing.
In a recent survey by Digital Context Next, it was found that publishers experience the most success in driving the younger generation to their site through Facebook (66%), followed by Twitter and YouTube (both at 48%). However, Gen Z and young Millennials responded in the survey that Facebook was their fifth-favorite preferred content channel and Twitter in seventh place. YouTube was the front-runner by and far.
So, there is some sort of disconnect between what publishers are doing and what the younger generations want and how they actually act.
The survey did reveal, however, that publishers and this younger generation are on the same page—short-form video content was chosen by publishers as the content format as the best for engaging Gen Z and young Millennials, while that age group also reported it is the format they most prefer.
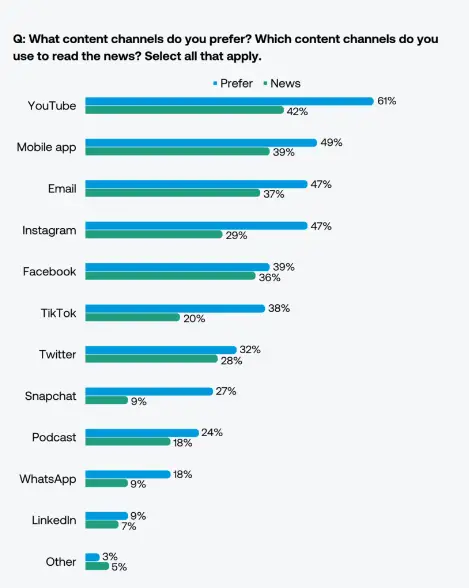
Publishers who continue to engage with this younger generation in the way that the generation prefers are going to continue to be relevant, drive traffic to their website, and earn revenue. It won’t be long until they are the largest generation of internet users and it is important to know what they want and how they want it.
Publishers will earn more ad revenue in 2023 with these tips
With the potential coming recession, consumers have started making cuts, but the same is not necessarily reflected in advertiser spend; however, advertisers are being pickier about where they put their money. Considering this, publishers can do a few things that will earn them more ad revenue this year:
- User experience
Publishers who focus on user experience are going to fare better than those who neglect it. Personalized content and getting that content to the right people are going to be increasingly important this year. The more personalized your content is, the more likely relevant advertisers will show up on your site and if people are highly engaged with your content, those ads are going to be worth more, not to mention that more relevant ads are more likely to be engaged with as well.
Additionally, publishers should invest in video content, especially short-form video content.
- The value of data
The more a publisher understands who their audience is, the better they can leverage any first-party data they have. As the disappearance of third-party cookies looms above advertisers’ heads, they are more likely than ever to invest in that first-party data. Publishers who are strategic about which advertisers they spend time doing business with based on the content of their first-party data are more likely to fare better.
Of course, privacy is of great concern; publishers will need to be transparent about how they are collecting first-party data and what data they are collecting.
- Flexibility
Now, more than ever, advertisers need flexibility concerning their spending. They, too, are navigating an ever-changing ecosystem and are more careful than ever about where they place their ad spend—less than 50% of advertising video budgets were implemented upfront for 2023.
Wrapping up ad rates for the past two quarters
Ultimately, publishers who remain up-to-date on digital publishing trends—including AI, the younger generations’ content consumption trends, and video content—are going to be the ones that come out on top.
While ad rates are certainly not where many publishers thought they would be, especially looking back on the past few years, they aren’t as bad as they could be. Advertisers will continue to be picky about where they put their ad dollars, as it’s still not apparent if we’ll fall into a recession.
However, that doesn’t mean they aren’t spending at all—for once, advertisers are not completely pulling advertising even with the struggling economy. They’re just being more agile and staying away from any specific ad spending plans.
To improve your ad revenue over 2023, remember the following:
- Consider user experience
- Understand the value of your data
- Remain flexible
- Quality over quantity ad inventory
- Dynamic over static ad placements
- Content is still King
- Video is growing quickly
Good luck with the rest of this year, publishers! Stay on your toes as the industry continues to rapidly change.
PUBLISHED 3/16/23 at 8:30AM
Ad rates have dropped since February and with the current economic climate, in addition to Silicon Valley Bank’s recent failure, it is not surprising.
For those that missed it, Silicon Valley Bank (SVB), a bank holding the accounts of Silicon Valley start-ups like Buzzfeed and Roku, was taken over by the FDIC earlier this month. Many of its clients weren’t raising as much money as in previous years and thus began withdrawing from their accounts at SVB to keep the lights on; meanwhile, SVB’s government bonds were also down in value since the Federal Reserve has been raising interest rates. As more of its clients withdrew money, SVB had to sell its bonds at a loss, eventually tanking the bank.
It certainly does not provide confidence in the market.
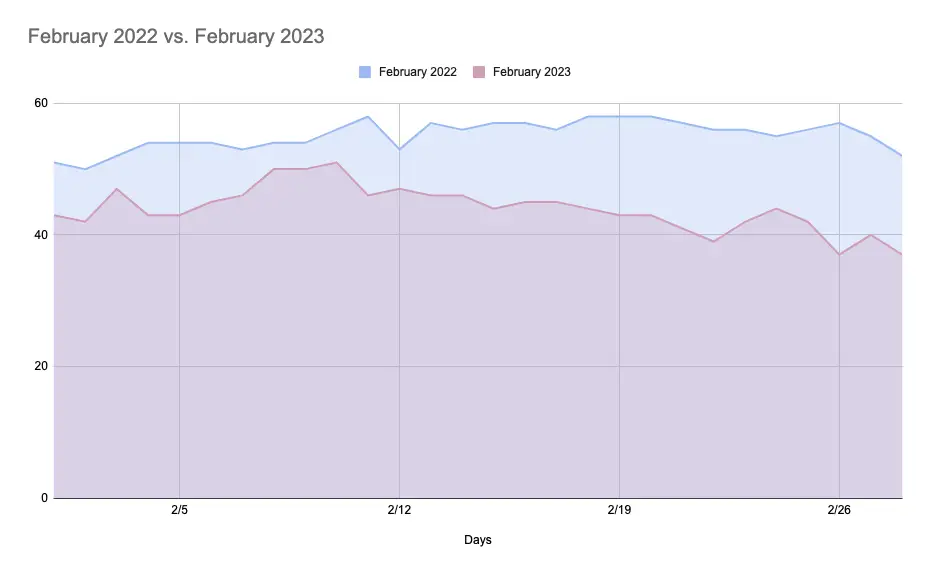
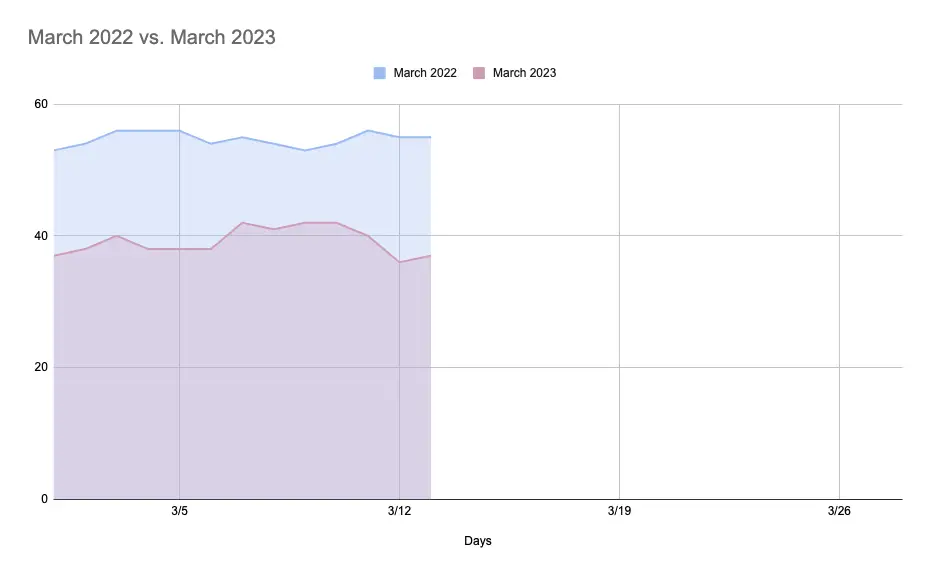
While February’s ad rates began dropping mid-month in 2023, March has proved more steady, though still roughly 20 points below what it was last year at this time.
News publishers are not optimistic about 2023
According to a report by the World Association of News Publishers, in which it surveyed 167 news executives from 62 countries, this year’s report is not nearly as optimistic as last year’s.
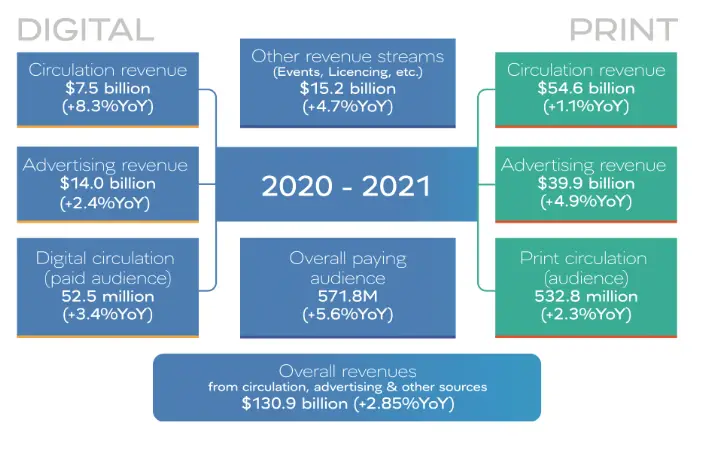
Last year, 80% of respondents reported they were optimistic about the next 12 months. This year, 55.4% answered they are pessimistic about the next 12 months. However, when asked what they think about the next three years, they were a little less pessimistic (46.4%).
Despite this negative outlook, 16.4% anticipated their revenue growing for 2022, compared to 7.3% for 2021. This may be, in part, to the news’ continued diversification of its revenue streams. Though print advertising revenue still accounts for more than digital advertising revenue, digital advertising and digital circulation made up 30% of respondents’ revenue.
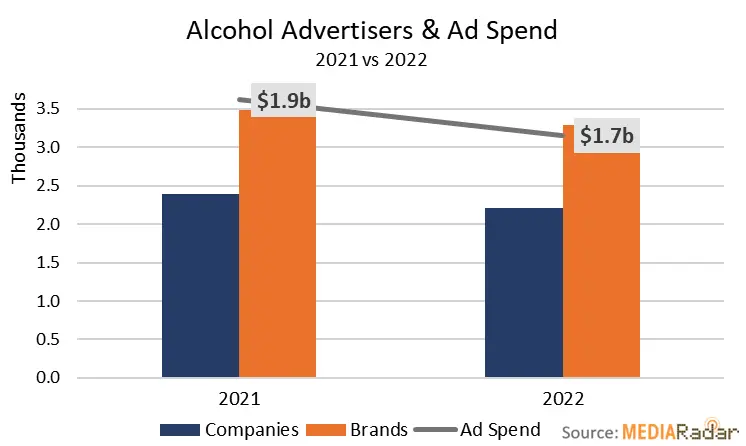
In 2021, 2,400 different alcohol distributors spent money on advertising; in 2022, 48% of those distributors did not return. It’s likely that those that did not appear last year were promoting smaller brands or bigger brands promoting new products that are no longer available.
For 2023, while beer and whiskey advertisers are spending less this year than last, wine, vodka, and tequila sellers are spending more.
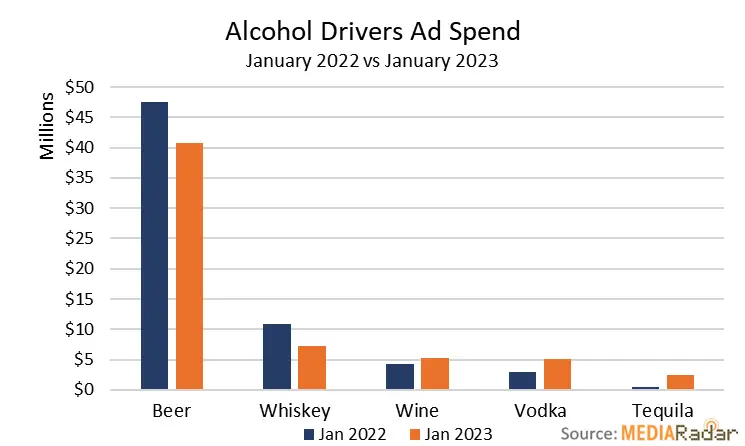
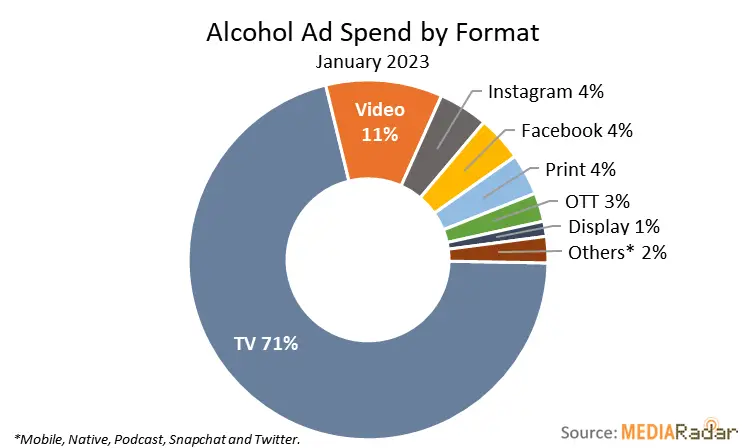
A more reserved approach may bleed into 2023, but it is likely that digital ad spending for alcoholic beverages will overall increase YoY. In January 2023, advertisers spent 23% less on TV ads than last year as well as less in print; digital media increased by 10% YoY.
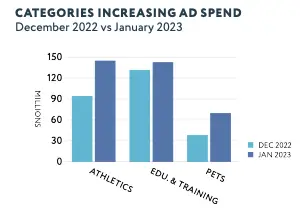
Important niches that increased their advertising spending MoM in January 2023 were athletics, education and training, and pets.
The pet care market is currently worth over $200 billion around the world and it’s estimated that US citizens spend over $123 billion on their pets per year, with elder Millennials spending the most per month.
YouTube Shorts not the revenue stream it was promised to be
YouTube recently decided to share ad revenue on Shorts from February 1 of this year but it is not going how it planned.
The split—creators earning 45% and YouTube earning 55%—is not as good as other revenue shares, the eligibility threshold is lower; creators with over 1,000 subscribers and either 4,000 valid public watch hours in the last 12 months or 10 million valid Shorts views in the last 90 days can earn revenue from Shorts ad revenue. So, for example, if a Shorts video is viewed one million times, it is distributed 1% of the Creator fund, or $900. 45% of $900 is $405, so the creator would earn $405.
Before the revenue share split, there was the YouTube Shorts Fund, or $100 million that the platform had determined was for its creators.
However, now that ads are a part of the Shorts, watch time and thus revenue are down, even though impressions and views are up.
While Shorts was created as an answer to TikTok, it’s not nearly as popular, and ultimately does not help what the platform is best known for—long-form content, which is more likely to make more money than just Shorts revenue.
IAB proposes new change in video ad categories
The Interactive Advertising Bureau recently proposed a new classification for instream video ads, which could have an effect on both buyers and sellers.
Currently, instream ads are ads that play before, during, or after a video, either in a video player or as an overlay. The proposition is to split instream into two categories: primary instream and accompanying instream. Primary instream ads would require that the viewer start the video and have the sound on. Accompanying instream ads would then be played automatically with the sound off.
As US digital video ad sending is expected to reach $93 billion in 2023 and over $143 in 2026—its growth beating digital ad spend—this could have major implications for how creators make money. Instream ads are the majority of video advertising on YouTube and social networks like Facebook Watch and Snapchat Shows.
Q1 wrapping up
We’re reaching the end of the first quarter of 2023 and to say it hasn’t been the most positive is an understatement for many publishers. While ad rates may not be as we hoped for Q1, it is important to remember that the ad rates in 2021 and even 2022 were outliers; they were just reactions to the pandemic and not the way ad rates were heading for good.
If we look at ad rates before the pandemic from January through March and overlay January through March of 2023 on top, we can see that ad rates are actually better right now than they were before the pandemic this same time of year.
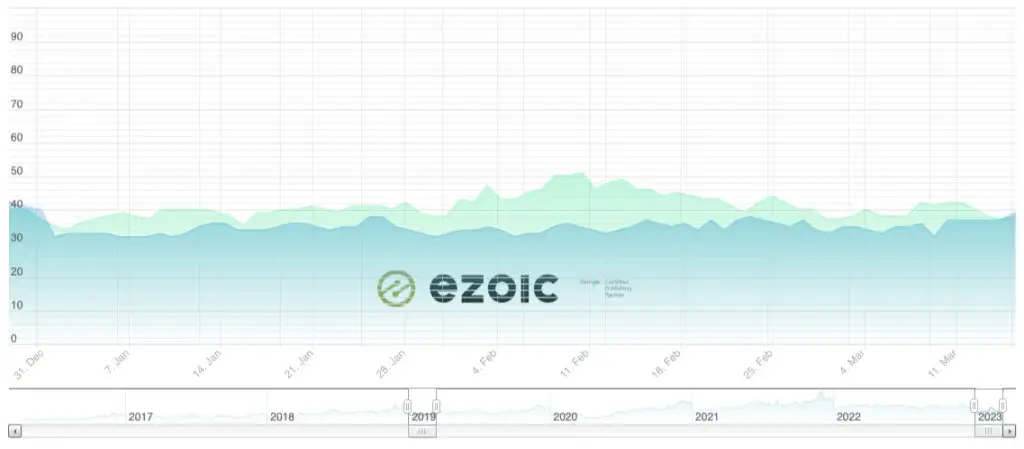
If we account for inflation (17.67% increase since 2019) when considering current ad rates versus those in 2019, ad rates are only slightly lower than what they “should be,” given inflation.
Advertising trends in digital publishing niches
According to a media advertising overview by MediaRadar, over 11,000 new advertisers were added to the market in just January 2023. However, there was a 34% YoY decrease in the number of companies advertising and a 30% YoY decrease in the number of brands.
Specifically, niches that decreased advertising investment MoM in January 2023 were apparel (55%) and alcohol (38%).
It is expected that revenue in the alcoholic beverages market will grow 5.5% per year between now and 2027. This comes out to $283.8 billion just this year. However, despite this expected growth, advertisers decreased their spend from 2021 to 2022 by 17% YoY.
PUBLISHED 3/3/23 at 8:30AM
Ad rates have dipped a little bit since our last update after a slow increase over January and the beginning of February, and are anywhere from ten to nearly twenty points different than last February.
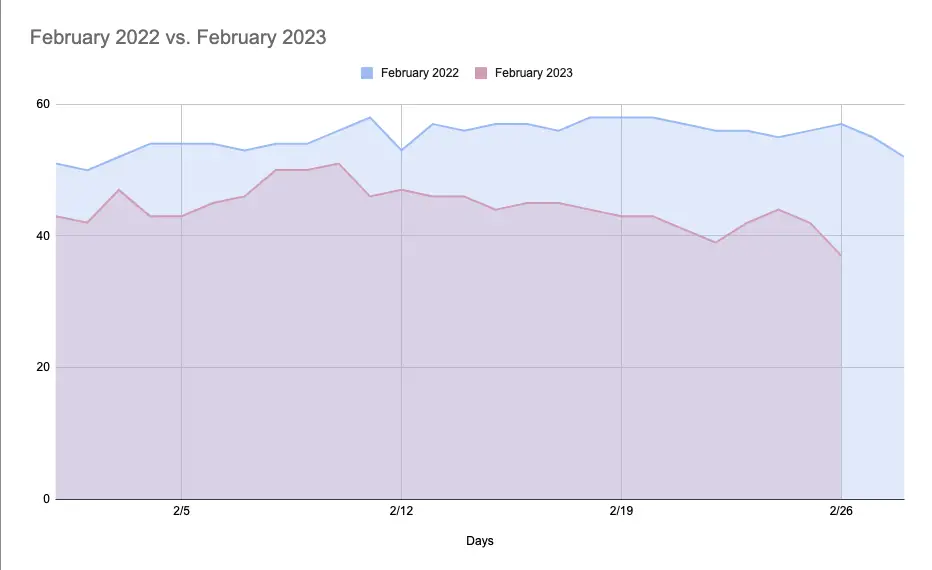
However, looking at January versus February, the overall average trend of ad rates is heading upward, when looking at MoM.
Ad spending is not as low as originally thought
One of the most common occurrences during economic downturns is for advertising budgets to get pulled since it’s easy to stop and start campaigns and it’s not a huge necessity to keep the lights on.
While there are certainly cuts to advertising this time around, it is different than most times this has happened; it seems that digital ad spend does not parallel the economy quite as much as originally perceived this time around.
While there are surely cuts to advertising, there are many advertisers that didn’t cut anything, and still more that increased spending. Major brands like Kraft Heinz, Unilever, and Procter & Gamble all reported they are increasing ad spend in 2023. Many of these brands are realizing that cutting advertising every time the economy drops isn’t sustainable, and instead are just raising the prices of their products with the belief that shoppers will pay.
Predictions for 2023
Brand safety is going to be the number one concern for almost every brand regarding advertising in 2023. People expect brands to have opinions on important topics like the environment and no brand wants to look bad and then have it go viral. But this growing concern for brand safety includes more than just the content of their ads; it also includes where those ads show up. Brands want their ads to feature on high-quality sites. This is likely to grow in 2023.
Additionally, video ads are on the rise, specifically the short-form, personalized kind. Last year, 82% of online activity had a video form component. Additionally, 96% of consumers prefer to watch a video before purchasing something.
Right now, over 80% of videos are skipped, especially if they are longer than 15 seconds. However, when the ad is personalized, videos are watched until the end an average of 85%.
In other news, with rising interest rates, it’s likely some companies will need to consider consolidating or selling some of their assets to stay afloat; for example, Disney is considering selling Hulu, even though Hulu is growing and Disney just became its major stakeholder a few years ago.
If this is true, change-of-hands like this will create opportunities for other companies to take advantage of lower prices in ad inventory as this environment is disrupted.
Looking at digital ad spend trends, eMarketer recently reported that U.S. digital retail media ad spending is expected to be 20% of digital ad spending by 2024. In dollar signs, that’s $61 billion.
Additionally, while this may come as a surprise to some, government spending is actually good for advertising. The war in Ukraine has made certain industries’ demand much higher, which has increased their ad spending. The government recently passed the CHIPS and Science Act, which will spend $280 billion in funding for semiconductor domestic research and manufacturing. Another act, the Infrastructure Investment and Jobs Act will spend $1 trillion in road, bridge, and tunnel updates all over the US. Both of these acts will create more jobs, require more travel, and generate more business opportunities, all of which include advertising.
Advertising spend trends overview
Automotive ad spend increased over 140% WoW from January 30 to the week of February 6 after three weeks of ad spend decline.
Media & Entertainment increased 50% WoW in the same time period, $100 million of which was for movie advertising.
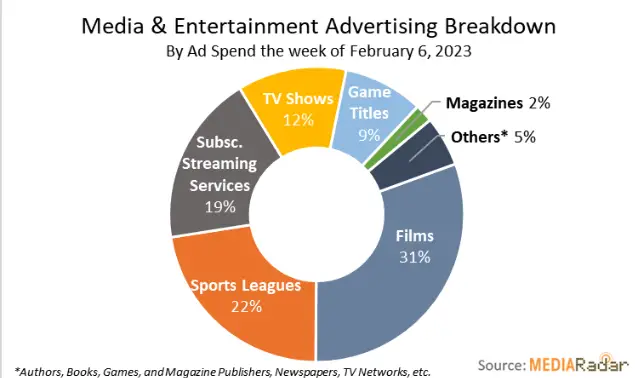
Technology advertisement spending increased 25% WoW, with consumer electronics ad spend increasing nearly 50% WoW.
A category that was down was Services, with a 25% WoW decrease. Specifically, Health and Fitness services were down 30% WoW and Medical and Dental services decreased by almost 40% WoW. Media Rader’s full report can be found here.
If you’re a publisher in automotive or media and entertainment, now may be your time to shine. Consider what is popular in those industries right now—for example, the new Marvel movie, Antman and the Wasp—and how you can cater to those consumers and, ultimately, advertisers.
PUBLISHED 2/16/23 at 10:30AM
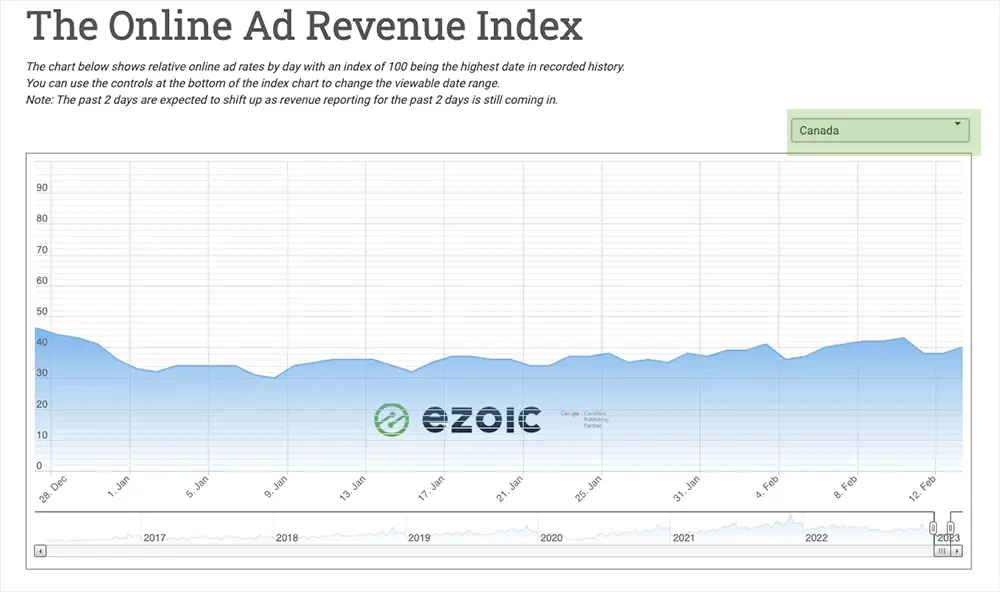
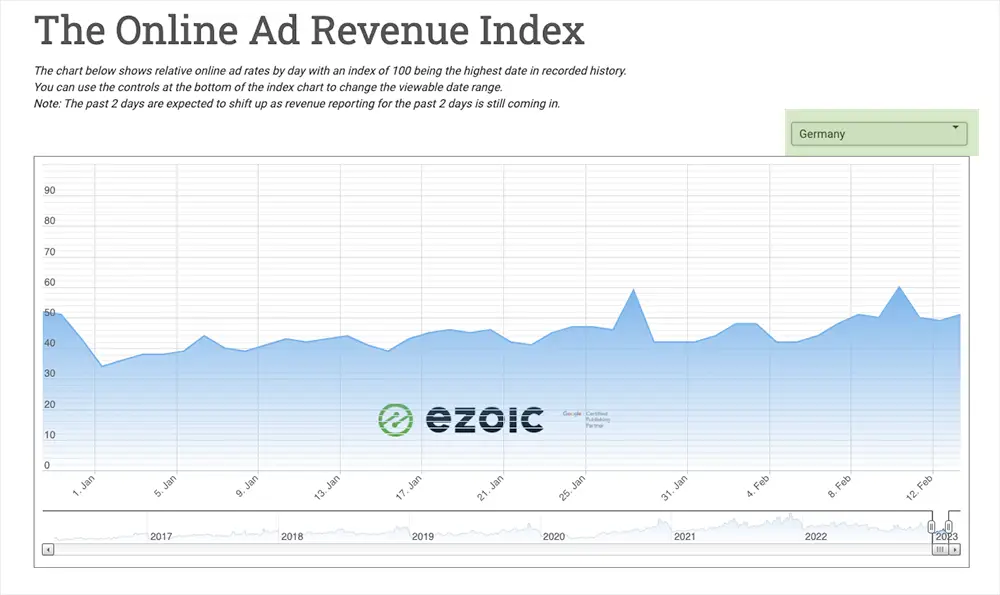
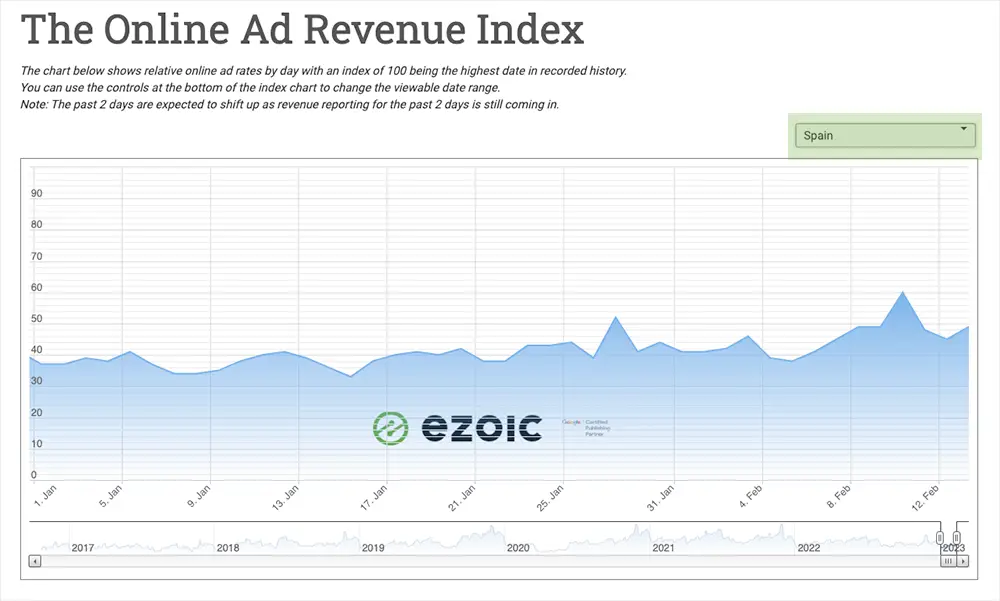
Although ad rates are still lower than this time last year, they have been continuing to rise throughout January and February.
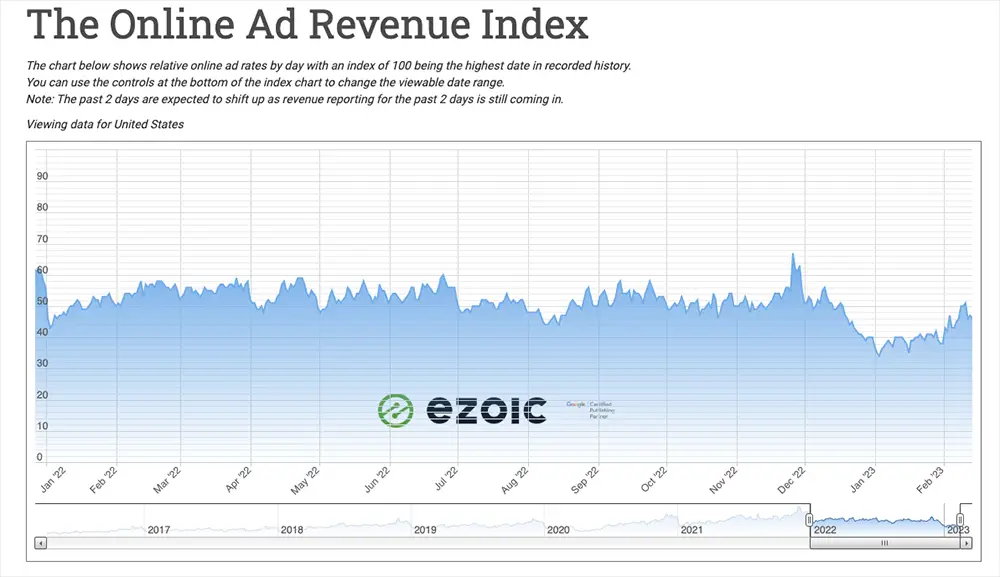
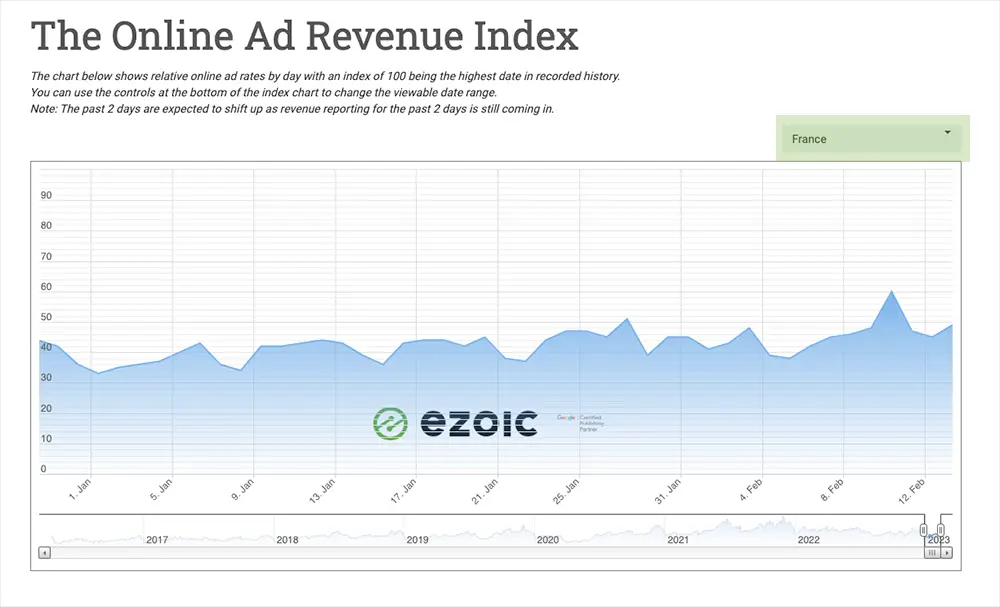
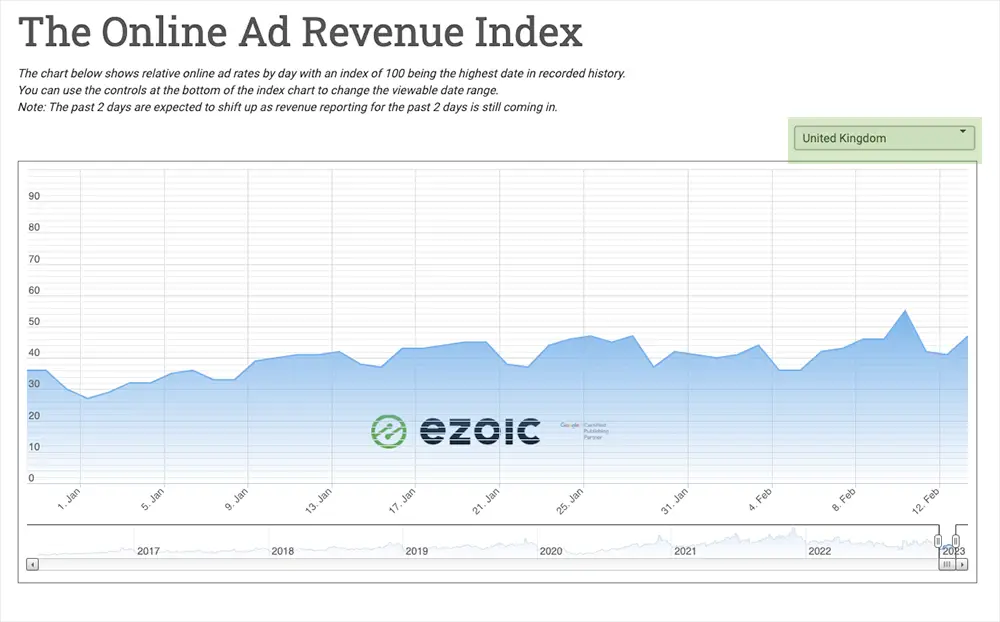
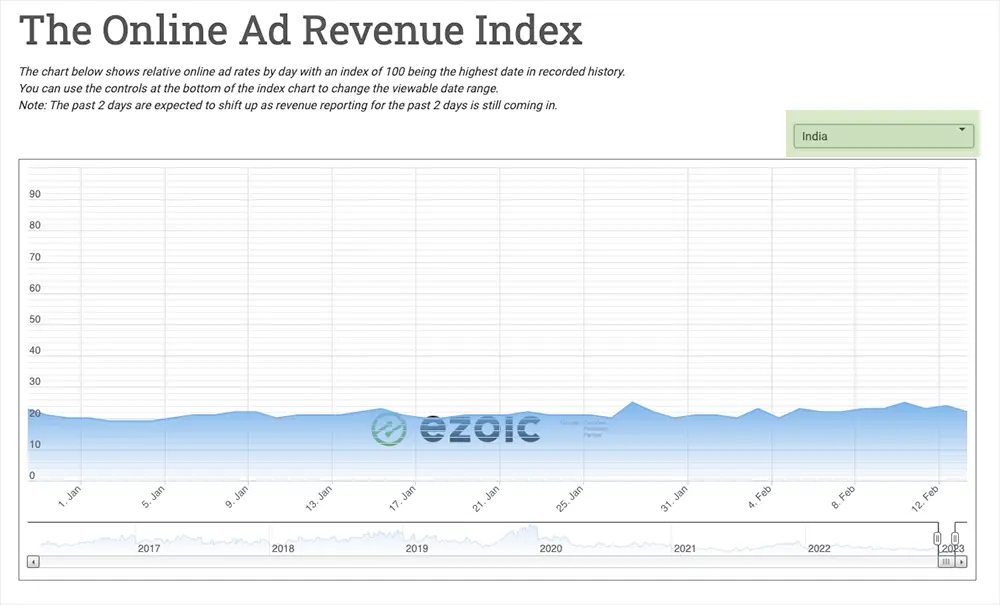
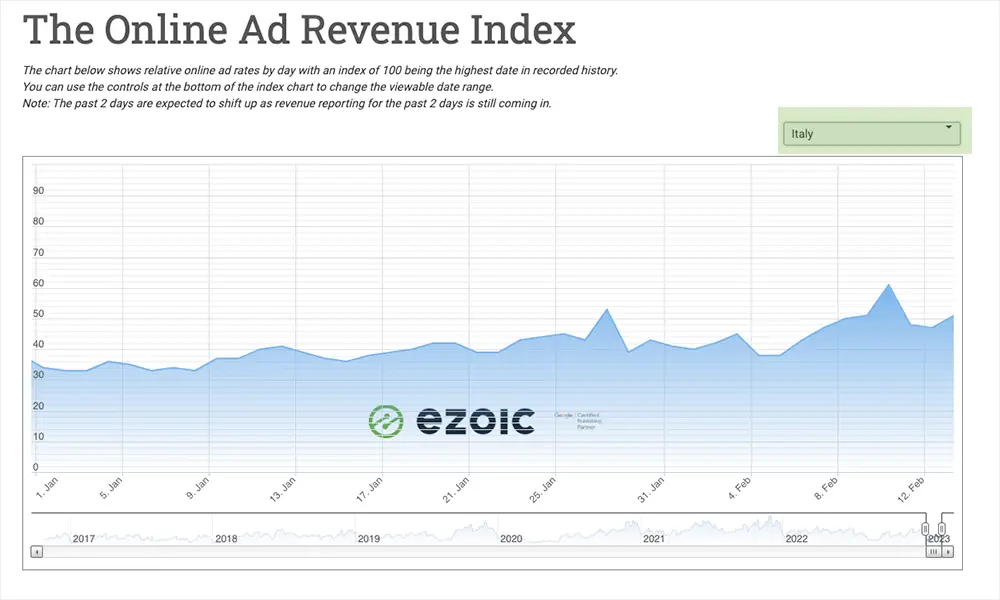
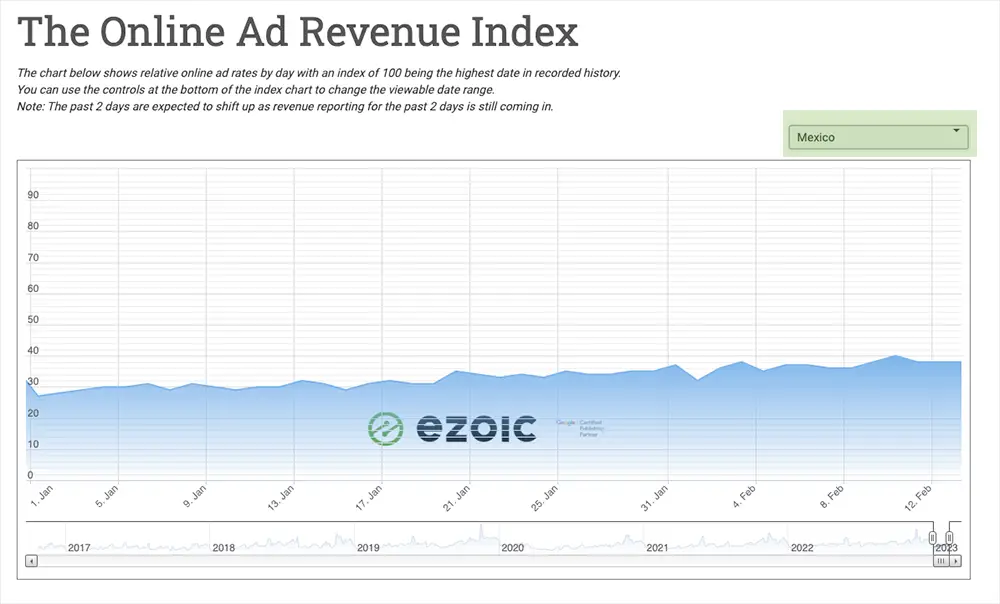
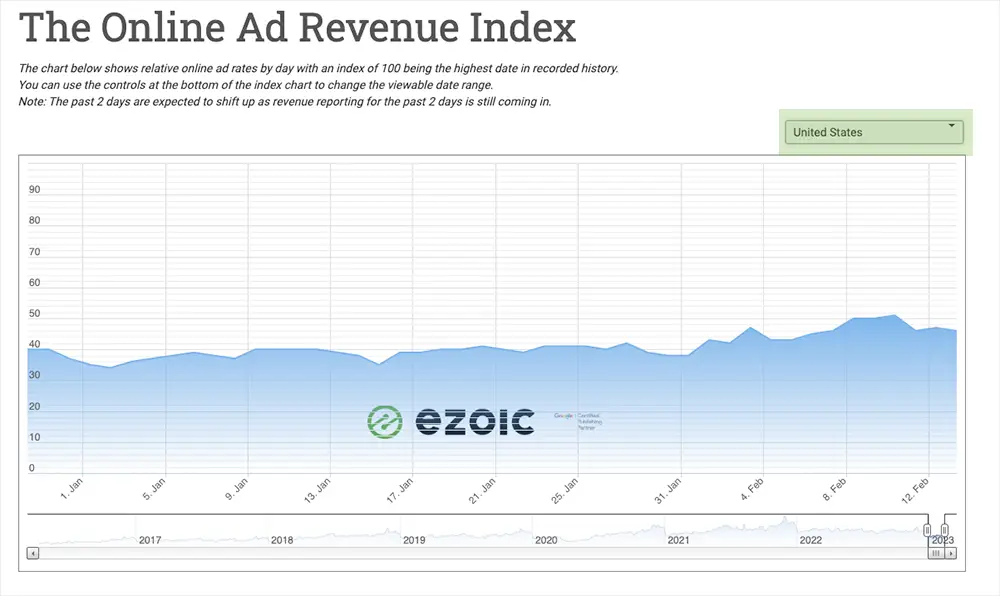
If we look just at 2023 for the US, you can see a slight incline over the last month and a half. This is also true for Canada, Germany, Spain, France, the United Kingdom, Italy, and Mexico, though most of the inclines are slight. The only country that hasn’t seen much improvement in ad rates throughout January and February is India.
If you would like to remain in the loop on ad revenue rates for different countries, you can sign up at the bottom of the Ad Revenue Index page.
If ad rates continue to rise, we will be fairing better this February than in February 2021.
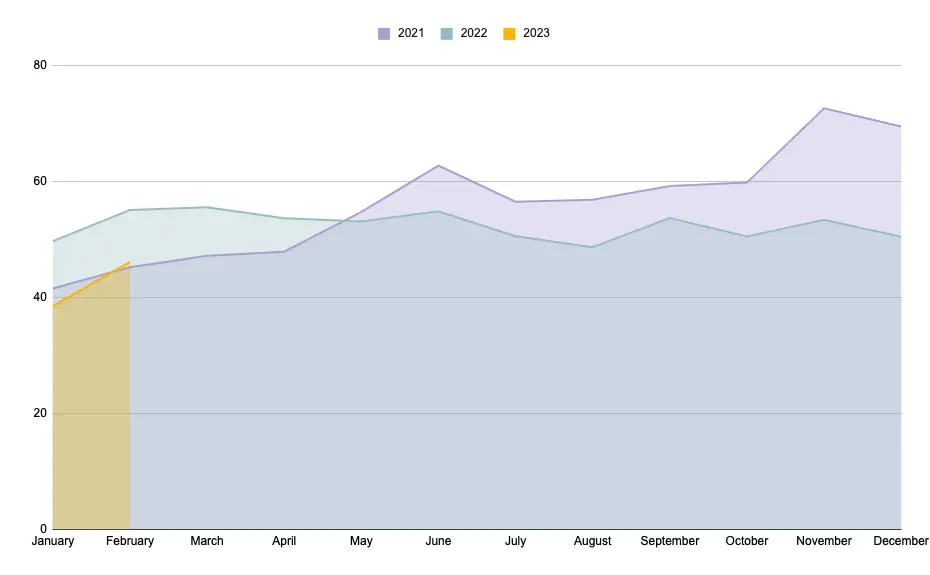
What’s important to recognize and remember is that 2022 was an anomaly, not the new norm for ad rates and behavior. It’s best for publishers to adapt to the current state of ad rates and make plans based on the current behavior because it is not likely to change anytime soon.
Trends in digital advertising right now
Despite events like the Southwest holiday flights fiasco and the FAA’s system outage a few weeks ago, airlines are still set for big revenue this year; after taxes, U.S. scheduled passenger airlines’ after-tax net income was $2.4 billion for Q3 2022.
Spending on airline and travel advertising is set to continue in 2023, as airlines were hit hard during the pandemic; it’s estimated that in just 2020, the airline industry lost around $370 billion.
Travel websites may benefit from airline advertising this year more than other niches. Content on airline travel or airline companies could be an opportunity.
More recently, the food and apparel industries are opening up their wallets. According to MediaRadar, food advertising was up over 100% WoW. Specifically, food subscription services and candy (as Valentine’s Day approached) each rose over 1,000% WoW.
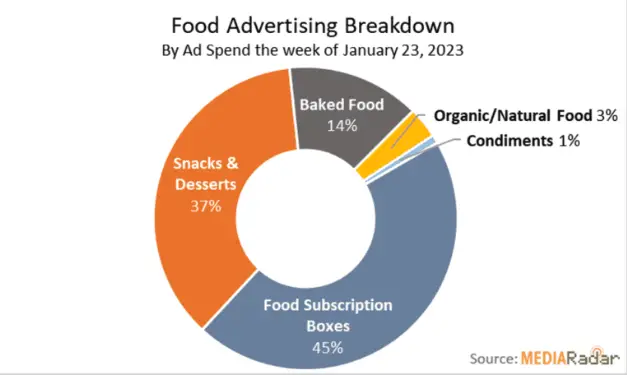
There was a small increase in apparel advertising spend at just less than 5% WoW; however, it’s the first week there’s been a WoW increase since the end of November.
While airlines may be boosting their ad budgets, a few industries are pulling back on the reigns: pharmaceutical, education and training, and pets.
Pharmaceutical spending experienced a 25% WoW decrease at the end of January and education and training advertisers decreased ad investment by 20% WoW.
It comes as no surprise that the pet industry is experiencing a decline in ad spend; during the pandemic, 23 million American households adopted a pet. Pet industry advertisers went big during the pandemic to ride this wave, spending millions of dollars to advertise to pet owners.
In 2022, pet companies decreased ad spending by 8% YoY while pet brands decreased their spend by 20% YoY. Most of this decrease came from the pet food category.
Pet-related websites may see the effects of this decrease, as they likely experienced a surge in ad dollars during the pandemic. The pet trend is fading as increasingly more people are going back to the office or going hybrid, so it’s unlikely the pet industry will experience an increase like during the height of the pandemic.
Video content is one of the greatest digital publishing trends on the rise right now, which means the future of digital advertising also includes video ads. Online video consumption is continually growing and it was predicted in May 2022 by the International Advertising Bureau (IAB) that video ad spend would exceed $49 billion in 2022, an increase of 26% YoY.
Specifically, Amazon will be building out its video ad capacity in the near future, specifically with generative AI. With all of the data that Amazon has collected over the years through searches, purchases, streams, and ads clicked. While digital advertising may have slowed down for most, Amazon very well make this their opportunity to ramp up their digital advertising efforts, with a focus on AI-generated video ads.
The rise of the AI chat tools: ChatGPT and Bard
Speaking of AI, it would be remiss of us not to mention the rise of AI chatbots. Microsoft’s partnership with OpenAI has produced ChatGPT while Google was quick to release its own version, Bard, created using LaMDA, Google’s natural language processor (NLP).
Both Microsoft and Google have teased their chatbot integrations with search, and it will certainly change the way people search. As discussed in the Publisher Lab podcast, Bing’s version featured to a select group of users, with the homepage prompting ‘Ask me anything.’
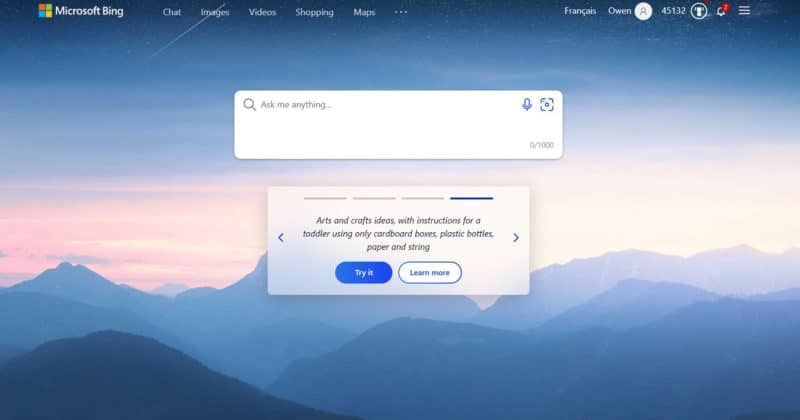
What may be a cause for concern for some publishers is how all of this is going to affect their revenue. How do publishers begin to get credit, or even traffic, if everyone can get their answers from a chatbot that can browse the entire internet and formulate an answer?
It’s not all bad news, however.
As also discussed in the podcast, search has long been used for things it wasn’t mean to be for a long time. While chat tools will certainly make search look different, it will not change the need for quality, informative content that isn’t just a quick answer to something like ‘what was the score of Super Bowl LVII?’
These chatbots are good at giving basic information to users and can create responses based on what it finds in content. It’s altogether not a horrible writer, and is probably better than some humans. But, it is limited because it cannot write original content. Only real humans can include creativity; AI can only copy it.
PUBLISHED 2/3/23 at 7:30AM
Welcome back to another ad rate update!
Ad rates have remained stagnant as we arrive one-third of the way through Q1. US ad rates are currently down 22% compared to last January.
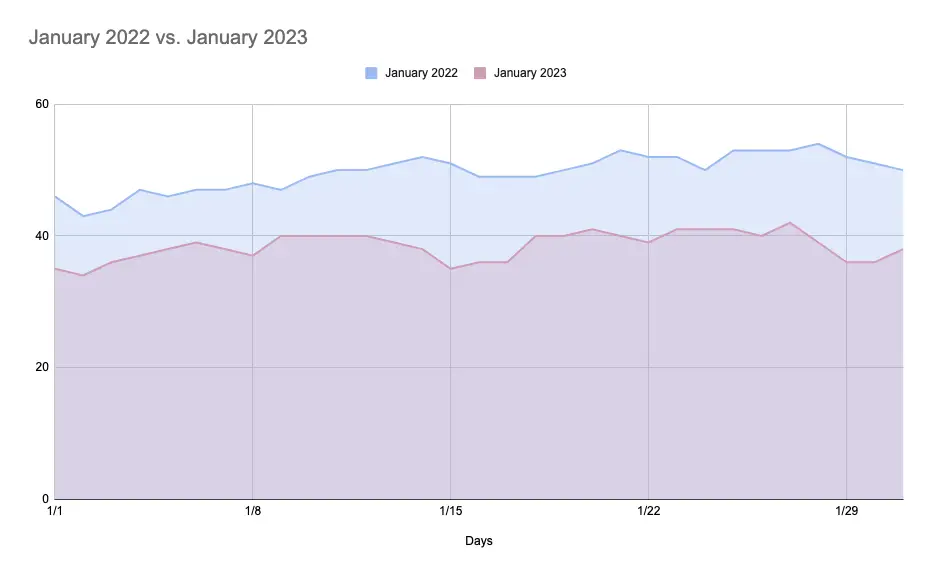
What’s important to remember about January 2022, however, is that it started off riding the high of the end of 2021. It then dipped starting around August and stayed level for most of the rest of the year.
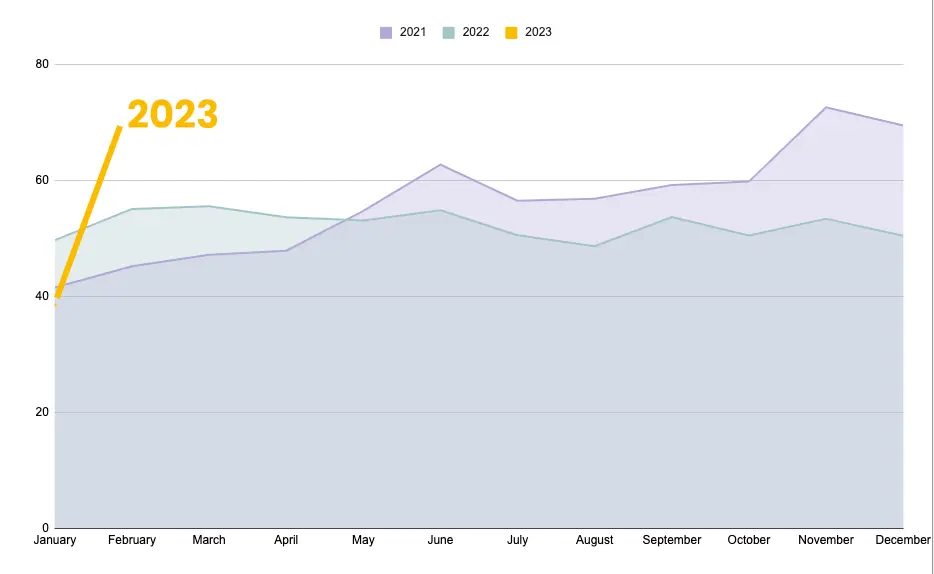
All that said, it is likely ad rates will remain where they are for most of Q1, as advertisers are playing it safe. Ad rates are currently higher than in all years prior to 2021.
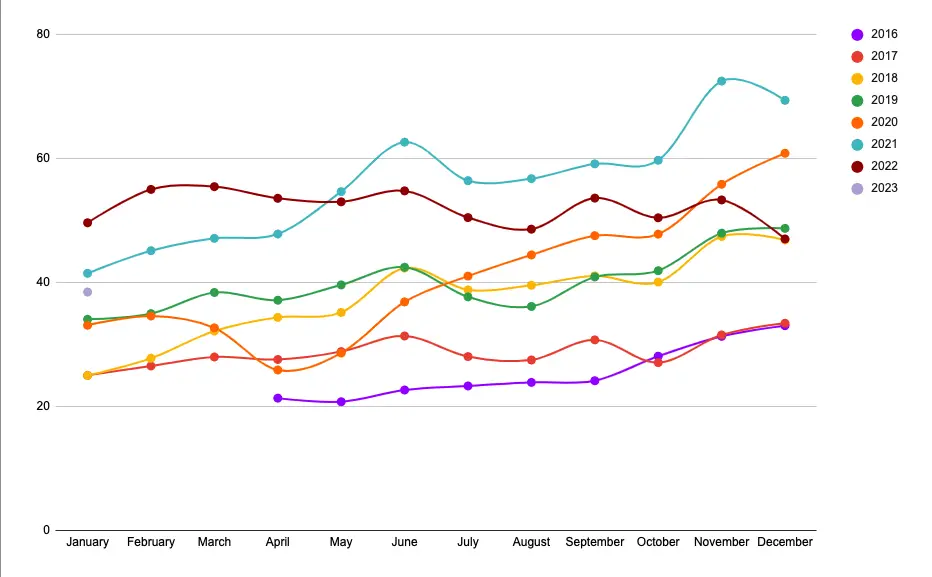
If you were hoping for a ‘2021 effect’ this year to make up for lower ad rates in 2022 just like after 2020, you’re unlikely to see it. 2021 was an outlier and a result of the world opening up once more, not just as a way to make up for poor ad rates in 2020.
2022 was then the year everyone watched as the economy slowly became worse and worse, and people began pinching pennies increasingly more. By the end of 2022, it was obvious things were likely to get worse before they get better, and ad rates dropped off.
We are still living in the aftermath of that, and it is likely that advertisers are going to continue to be conservative in spending, as consumers are likely to spend less in general while we all wait to see if a recession is imminent.
Which niches saw improved, decreased ad rates
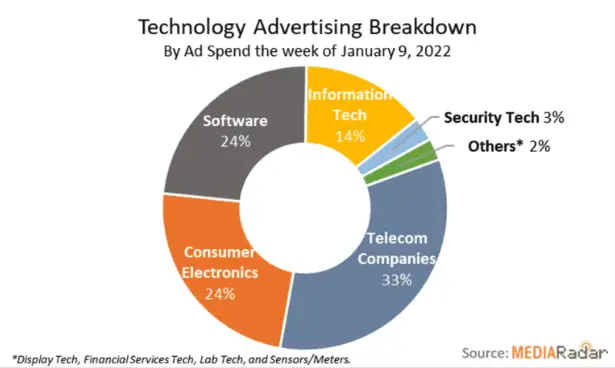
The trend ‘Dry January’ has ad spend for non-alcoholic beverages up the week of January 9, 2023, compared to the week prior. According to MediaRadar, advertisers spent $7.5mm, which is a more than 40% increase WoW. Specifically, advertising spending for soft drinks rose 1,000% WoW.
Tech advertising saw barely any changes in ad spending, though telecommunication companies (Verizon, T-Mobile, etc.) reduced their ad spending by nearly 20% WoW. This shouldn’t be surprising, as many telecommunication companies do big ad spend pushes around the holidays. Information technology, however, like GoDaddy and Wix, was up 150% WoW with over $25mm spent on advertising.
Beauty advertising spending has been in decline since right after Christmas; the week of December 26, 2022, ad spend was down 30%; the following week, it experienced another 20% decline. The week of January 9, 2023, saw another 5% decrease. Interestingly, ad spending on cosmetics was up over 1,000% WoW, amounting to nearly $10mm.
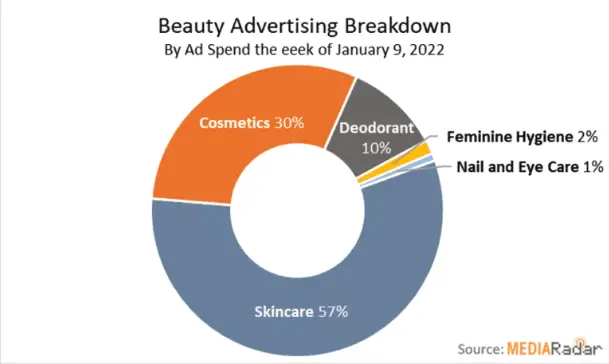
The most interesting ad spend trend was that Athletics experienced a decline, which is not typical for this time of year since this is a popular time of year for health-related ads, as many people set New Year Resolutions to be healthier. Ad spending was down 50% WoW.
Publishers in these niches may have noticed their EPMV and/or revenue drop or rise, depending on which category their website falls in. If you’re a recipe site, Dry January is officially over, so it may be advantageous to make some fresh content on alcoholic beverages; don’t abandon articles on non-alcoholic beverages, however, as there are still plenty of people who extend Dry January past the end of the month.
If you’re an information technology site, it’s possible to get in on this ad revenue by creating good content on products and tools to create websites, possibly a ‘pros and cons’ article. It seems as if these companies are doing big pushes right now, as it’s likely people will pick up new hobbies and set new goals for 2023; one of them may be starting a website.
By following ad spend trends, you can look to see how your niche’s ad spend is looking, and make content that is more likely to receive ad dollars.
Social media will be hit hardest by decrease in digital ad spend
Speaking of ad dollars, the channel seeing the biggest decrease in ad spending during this downturn is social media.
An eMarketer report shows that the social media ad spending forecast has been reduced by $16.21 billion.
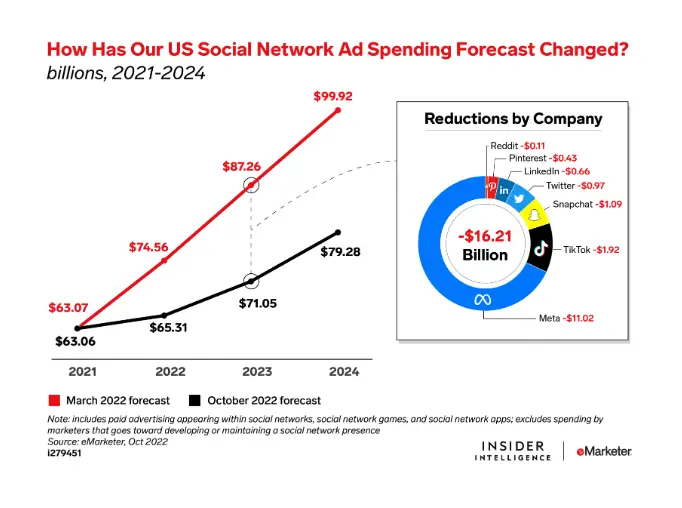
The biggest ad spend decline is coming from Meta, or Facebook, at $11.02 billion.
Some of this decline has to do with privacy changes, with Apple leading the way. Additionally, the possible coming recession, inflation, supply chain disruption, and geopolitical instability are making advertisers reconsider how they’re spending their money.
Site redesigns can affect your rankings
Speaking of ad dollars, something that may cause your site to lose ranking, and thus traffic and revenue, is redesigning your site.
Gary Illyes from the Google Search Relations team recently posted on LinkedIn that a site redesign may make search engines “go nuts.”
An article by Search Engine Roundtable says this happens because search engines use the HTML of pages to make sense of the content, i.e. when you break up paragraphs or remove H-tags because of some CSS styling you want, you change the HTML parser’s output. In basic terms, changing the core HTML can cause these ranking changes.
Instead, it’s suggested that publishers should try using semantically similar HTML when redesigning their site and avoid adding tags where they aren’t needed.
If you’re wondering why you’re losing ranking and you’ve recently completed a redesign, it may be that the search engine doesn’t recognize the site the way it used to. Redesigns can be beneficial, but only if they’re executed properly.
How marketers are responding to Google versus the DOJ
Marketers are reconsidering their relationship with Google after the DOJ recently filed an antitrust lawsuit against them. It’s the most serious antitrust challenge against the company to date.
If you are unfamiliar with the lawsuit, check out The Publisher Lab’s recent podcast.
Basically, the lawsuit targets Google’s sell-side tools and demands the break up of Google Ad Manager suite. Much of the suit is about how Google has been able to maintain a 20% revenue share fee that it has charged on its ad exchange since 2009. It does not, however, call for the break up of any buy-side items like paid search or YouTube, or demand-side platforms like Display and Video 360.

Even before the lawsuit, some advertisers had moved away from Google, like British Gas, and moved to independent ad servers, though this is certainly the exception.
At least at this point in time, there are few that can completely abandon Google; they are still the major player in this industry, and there won’t be any significant changes for years, especially as Google will fight the lawsuit. However, it is becoming increasingly easier to distance oneself from them, as more alternatives are being introduced into the space all of the time. Marketers will have to consider the cost of switching and learning other platforms against the value that Google currently brings them until things become more clear.
If you are connected to other platforms outside of Google to earn money from ads, you may see an increase in revenue trickling in from these platforms as more and more advertisers shift their time and money elsewhere to stay out of the crossfire of the lawsuit.
The changing atmosphere of the open programmatic market
The open programmatic market is in a time of transition.
There has been an increasing amount of programmatic auctions initiated by mostly lower-quality publishers—mostly those who only operate the site to make a buck—beginning to clog the ad tech pipeline. These publishers are running auctions for the same impressions as ad tech vendors simultaneously, who are attempting to reduce the number of auctions they’re a part of. While this makes publishers a lot of money, this is bad for advertisers because they could unknowingly bid against themselves.
As stated in the article, “…the lowest quality supply is occupying a growing share of programmatic inventory on the market as a result of auction duplication.”
While these publishers’ ads.txt files are growing as they allow an increasing amount of advertisers to bid on their ad space, advertisers have been slowly moving away from the open market and into private marketplaces. Of course, the open market is still dominant as of right now, so it is hard to completely move away from due to ease and the low cost of buying.
Instead of a premium programmatic marketplace that builds on many one-to-one deals with publishers, agencies are trying to keep their own supply of curated inventory that builds on many lookalike deals with multiple publishers, using supply-side platforms to do it.
Basically, these new ‘curated marketplaces’ could become the agency’s own ‘open auction.’
As stated, the open auction is still the most popular. There are ways to weed out the low-quality inventory and the number of auctions each programmatic marketplace can issue, but it can only do so much with the practices currently in place. As time goes on, filtering lower-quality inventory is becoming more and more sophisticated.
High-quality publishers who aren’t trying to game the system don’t have anything to worry about, but it is worth knowing that some agencies are looking to keep a closer watch on how their inventory is used and by whom.
What might the rest of Q1 ad rates look like?
With January 2023 in the rearview mirror, what have we learned about what the rest of Q1 might look like?
- Advertisers are being cautious about spending and that doesn’t look to be changing anytime soon, which means ad rates are likely to be stagnant for most of Q1
- Certain niches are going to perform better at various parts of the quarter, depending on holidays (Valentine’s Day, Black History Month), social trends (health and Dry January after the turn of the New Year), and how much money was spent in the niche previously
- Social media ad rates are falling below forecast, but it’s not to be completely ignored, especially with the rising popularity of TikTok; consider how advertisers may be reallocating some ad spend to social media and how you can use social media’s popularity to your advantage
That’s it for this update and we’ll see you again the week of February 13, 2023.
PUBLISHED 1/19/23 at 12:16PM
Welcome to the New Year!
Ad rates are still certainly below this time last year, but overall are better than January 2016, 2017, 2018, and 2020.
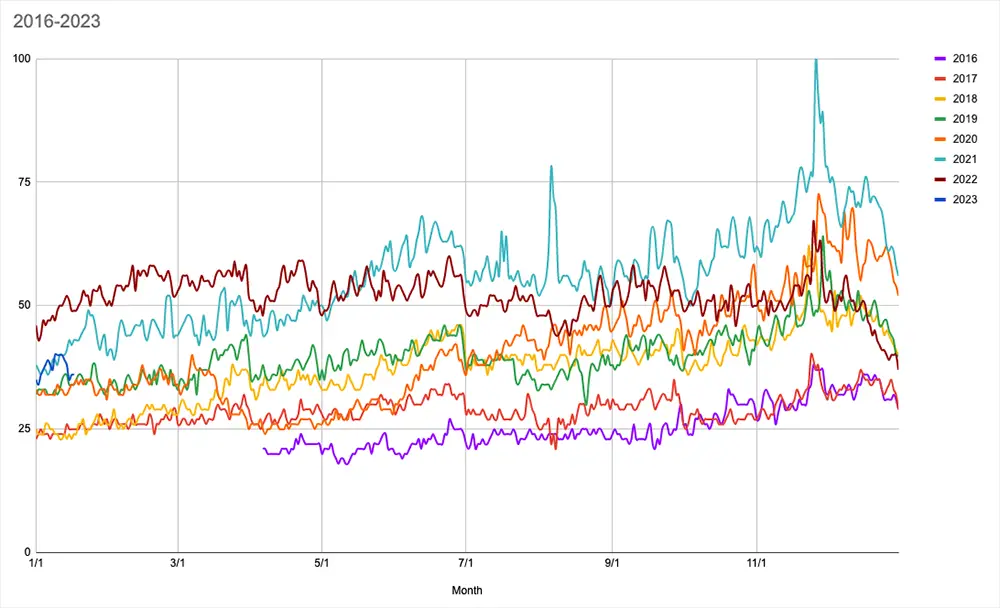
As you can see, ad rates in 2021 were a bit unprecedented for the whole year, as many businesses pushed advertising hard after the beginning of 2020 halted many businesses’ advertising efforts.
2022 started out strong but by May, it became evident that a recession may be on the horizon, and businesses pulled back. By the end of December, the big holiday drive was over and the financial downturn was eminent, so advertisers once again pulled their inventory.
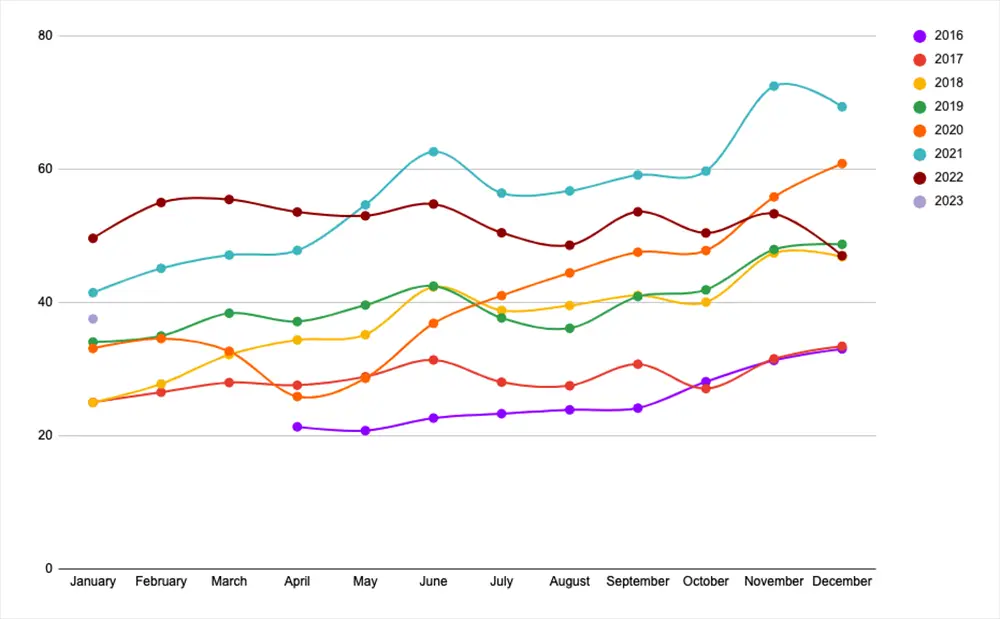
Now, at the beginning of January 2023, we are still feeling that hesitancy while the economy is still in flux. This January is certainly less optimistic than last January.
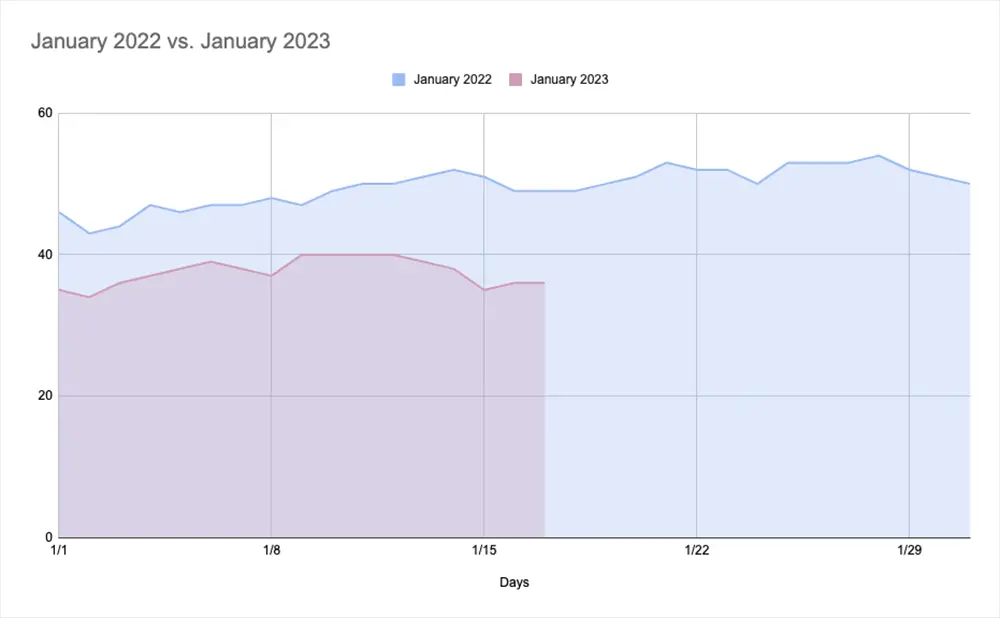
So what has been happening so far and what is predicted for 2023 Q? Let’s take a look at what information is available to us.
Traffic and ad revenue trends in social media
Unless you’ve been living under a rock, you’re probably well aware of Elon Musk acquiring Twitter and the radical changes he has made. Many of these changes have led to a decline in Twitter traffic referral to some publishers’ sites. Some of these websites include major news sources like CNN, The New York Times, and BBC, amongst others. Drops in referral traffic varied from 10-18% month over month. Most of this can be attributed to the removal of Twitter Moments in December 2022.
However, web publishing tech provider Automattic found that in a subset of 21 large and small publishers, website traffic from Twitter in 2022 Q4 fell by an average of 13%, though of the data set, 71% of publishers saw a traffic decline. Musk took over Twitter in late October, so not all can be attributed to the changes he has implemented.
Where Twitter stands with publishers in the future is currently undetermined. When people surveyed from nearly 50 newsrooms were asked, the majority said they would use Twitter about the same, while 20.5% said they plan to use it less. The rest said they would use it sparingly, more, stop using it, or take it day by day.
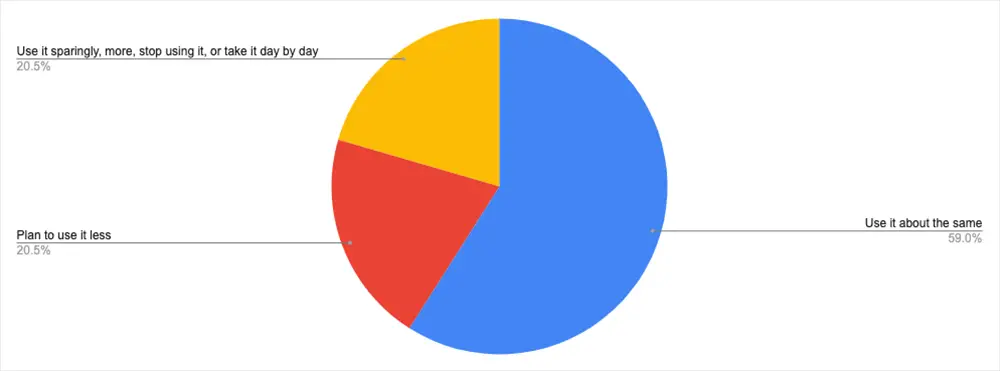
On the flipside, TikTok ad revenue is up, defying the general advertising slowdown and possibly adding to tension between the US and China. Currently, TikTok takes up about 25% of social ad budgets and has grown 50% year over year since 2020.
It’s anticipated that many advertisers will continue to test TikTok in Q1 and then scale throughout 2023. While other social media platforms are slowing in advertising growth or in decline, TikTok is picking up what those other platforms are losing. Additionally, it’s been proven that sound-on, full screen video ads are the most effectful ads (when they’re tolerated) and since this is the entire premise of TikTok, these ads do well.
Even with the promise of TikTok, predictions for social network ad spending are significantly down from original forecasts.
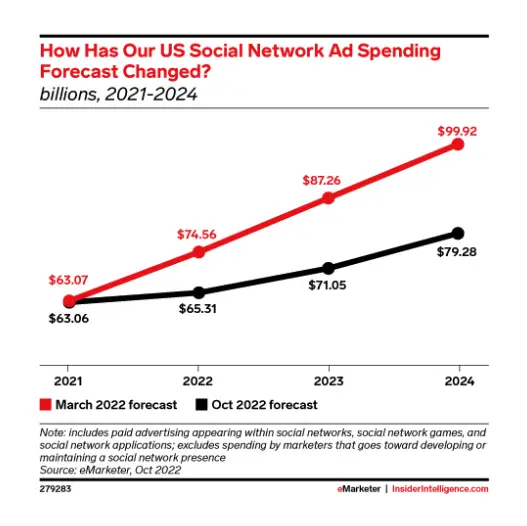
Advertisers cut overall spending, but some categories see increase
In an article published by eMarketer, it was reported that almost 30% of major advertisers are planning to cut their ad budgets into this year, and 74% of those advertisers point to the economic turndown as an influence in that decision.
While that may be daunting, it was also reported that 30% said their advertising budget will increase and 40% said it would stay the same as last year.
What categories will we see the majority of this money? There are a few key takeaways from Mediaradar’s weekly report, published the week of January 9, 2023.
Restaurant advertising and Health and Fitness both saw 400% increases in ad spend WoW. Restaurant advertising may have seen a spike because people were more likely to be out and about doing holiday returns. It probably comes as no surprise that Health and Fitness ad spend soared in the new year, as many people set new health and fitness goals as new year resolutions. Publishers in the categories may have seen an uptick in their ad revenue.
A category that experienced a decrease in ad spend was Food, specifically Snacks/Desserts and Meat; the former saw a 50% decrease WoW while the latter saw a nearly 100% decrease WoW. Now that the holidays are over, demand for these items has gone down, and the need to advertise for them has as well.
Travel specifically is seeing a great amount of growth, despite the fact that the economy is down. Even though travel is not a necessity but a luxury, according to a sample by MediaRadar, U.S. tourism organizations had already invested almost $623 million through April 2022, which is a 43% YoY increase from the same time period in 2021.
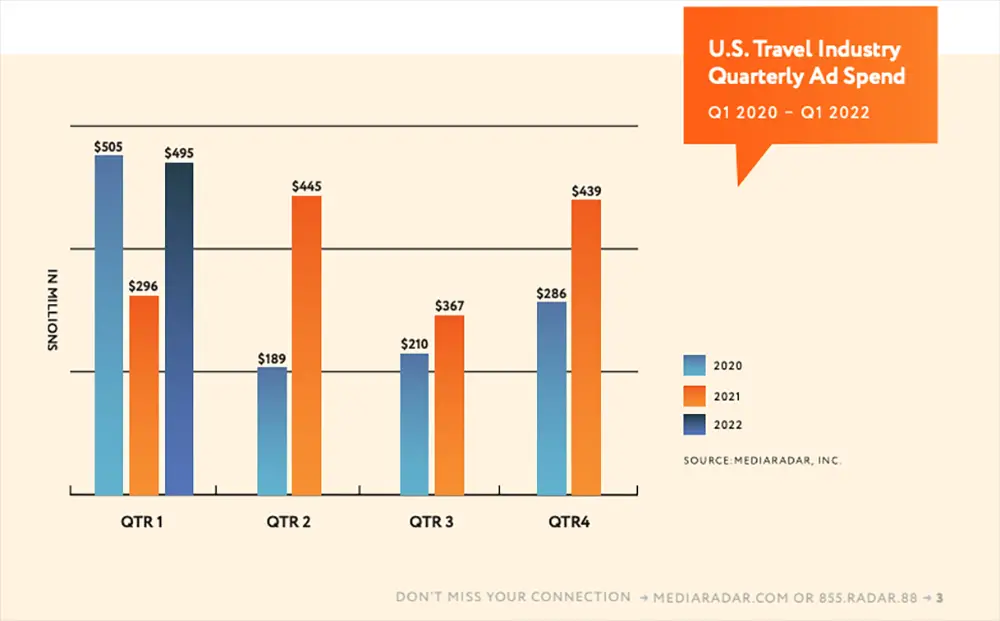
Why is this? It’s a combination of two things: something called a ‘booking curve’ and an increase in nomadic lifestyles.
A booking curve refers to consumers spending in advance of the actual use date; advertisers in the travel industry try to predict when people will book vacations by studying data on how far out consumers tend to book their travels. Families booking vacations four to six months out would want to book sometime in Q4, which is why travel is doing so well right now.
Additionally, as aforementioned, more people are working remotely than ever before, thanks to job trends still leftover from the pandemic. Many companies have become more flexible with their work-from-home/remote work policies and so many people are taking advantage of this and traveling more, as they are able to simply take their work with them. According to eMarketer, US travel’s digital ad spending reached roughly $5.23 billion in 2022.
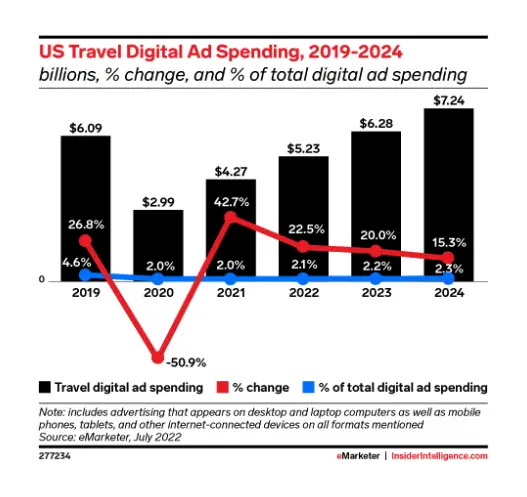
Predictions for Q1 2023
As most publishers have already experienced, ad spending in Q1 2023 does not look especially promising or a hopeful indication of the rest of the year. A recent Digiday article notes that marketers did not see the kind of sales they had hoped for in Q4 and so are approaching 2023 more cautiously.
Marketers are not tying themselves down to ad spending plans like in other years and are instead trying to stay more agile, much like during the pandemic, as consumer sentiment and the economy can change at seemingly any moment. Not to mention that there are still supply and labor shortages that are aftershocks of the pandemic, which slows down production and makes it more difficult to anticipate products’ availability.
It’s not all bad news, however. It’s predicted that CPG (Consumer Packaged Goods) ad spending is likely to be steady in 2023. This includes subcategories like skincare advertisers, increased their investment by 8% YoY.
Overall, it’s predicted that ad spending won’t bottom out, though the most recent forecast for US ad spending indicates that it’s down $5.51 billion from what was originally anticipated for 2023.
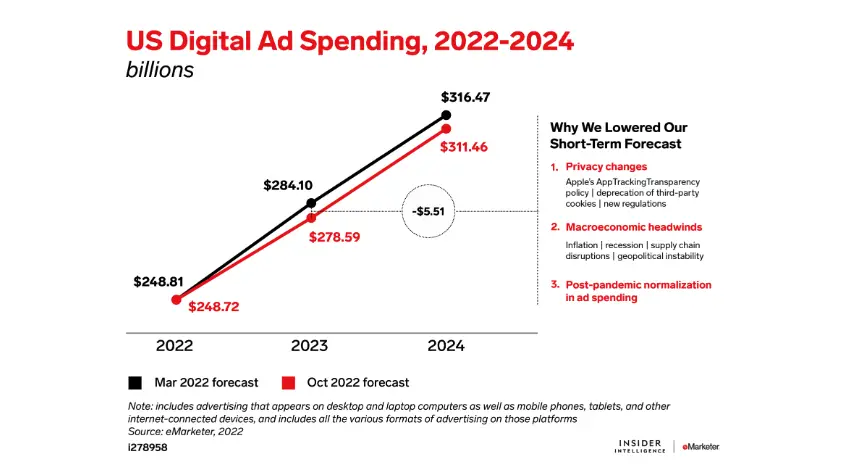
2023 is certainly going to be a year different from any other and it all seems dependent on how we weather the economic downturn and possible recession. We’ll be back with another update in a few weeks.
PUBLISHED 12/29/22 at 7:00AM
To say it’s been an unprecedented Q4 for ad rates is an understatement. Many publishers are feeling the pain this quarter as revenue is far below what is typical for this time of year, even though according to our data, visits have continually increased MoM and YoY for most niches we recently sampled.
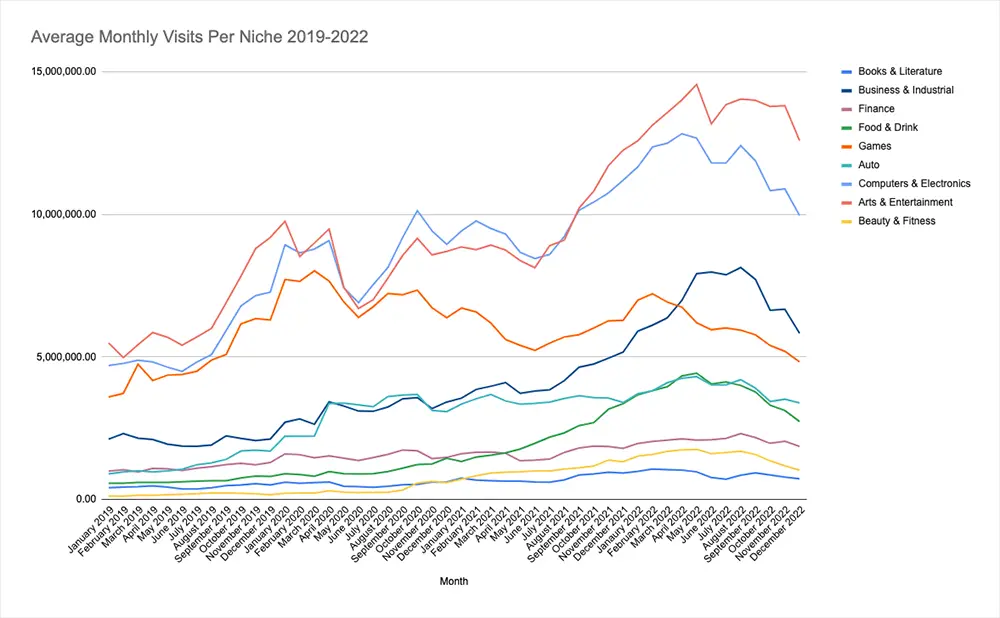
Ad rates are down for multiple reasons, and it’s hard to pinpoint anything specific. If you were keeping up with Ezoic during the pandemic, you may remember our ongoing blog we updated regularly with ad rate and traffic changes, trends in niches and e-commerce, and more. Since ad rates are not following the typical pattern of previous years, it can be hard to know what exactly is happening in the ad space and what to expect.
This blog will be similar to that of our COVID-19 blog in that we will update it periodically with valuable information from the digital publishing space to help you better understand how to stabilize or grow your site and plan for the future.
Ad rates before and after the pandemic
We recently pulled data from January 1, 2019-December 19, 2022 on Ezoic publishers in specific categories to see how ad rates have changed over time. To better see the trends, we’ve broken them up into two different graphs. Data was pulled on December 19, 2022, so our December data ends there.
EPMV (earning per thousand visitors) is a more accurate way to gauge website revenue, as it considers everything on your site that relates to and affects revenue—number of visits, ads shown during each user session, bounce rate, pageviews per visit, etc. This is a better way to understand your site’s revenue than RPM (revenue per thousand visitors), as it only includes revenue per page per thousand visitors, and is entirely dependent on the number of ads and their static placement.
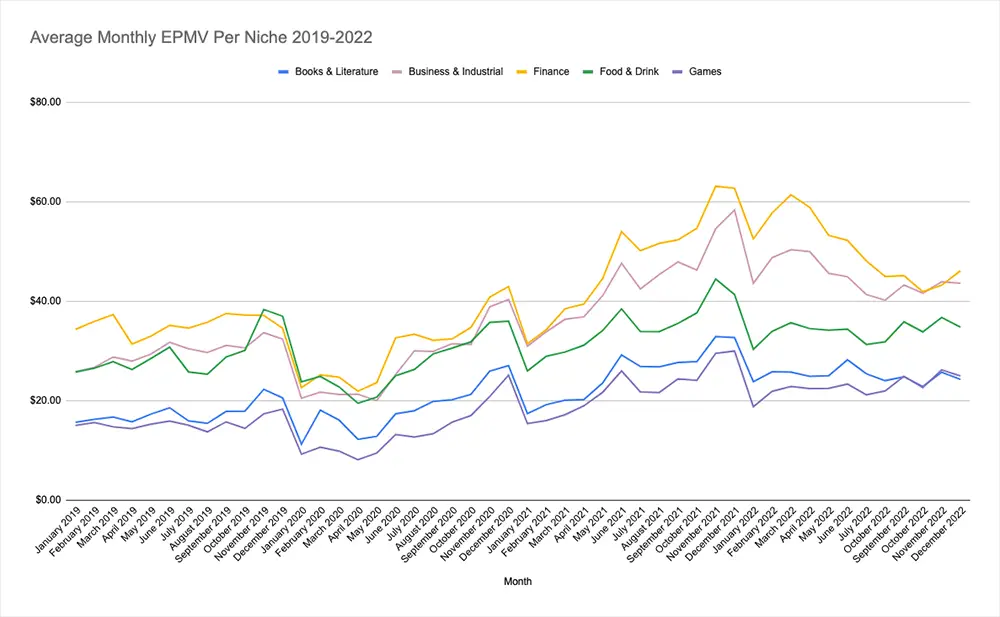
Ad rates were stable in 2019 but then all niches on this graph took a dip during the beginning of the pandemic. Almost all ad rates for these niches climbed back up in 2021, only to steadily fall in 2022.
As you will read later in this article, the Finance and Business/Industrial niche fared well during the pandemic more so than other niches because people were looking for financial and business advice during such unpredictable times, when many people could not work due to the nature of their job, experienced layoffs and furloughs, or just a general slowdown of consumers.
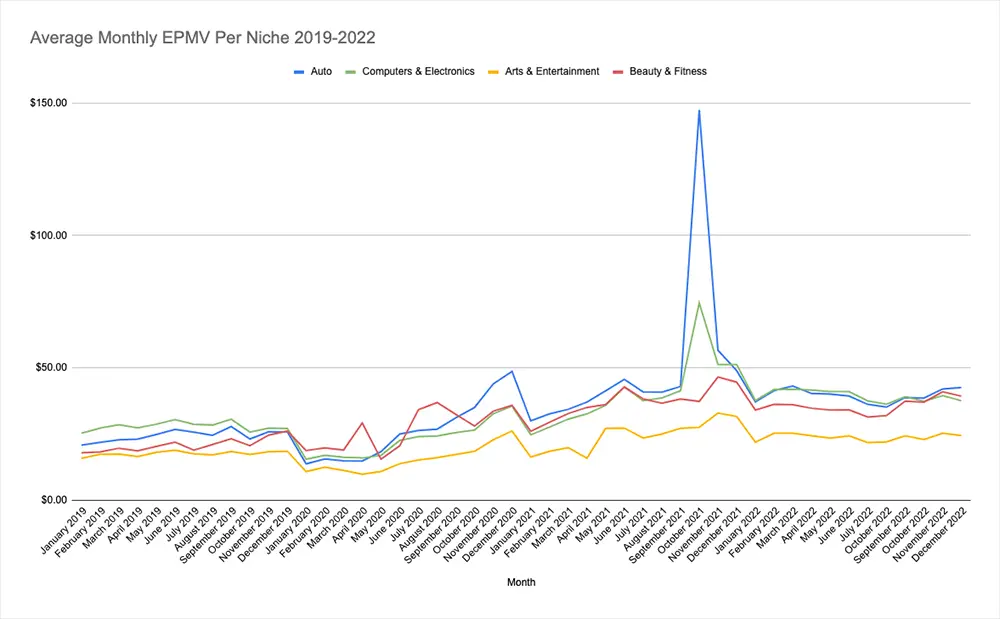
For some niches, like Beauty/Fitness, ad rates did not see as much of a decline in the pandemic compared to other categories, as many people stuck at home during the pandemic were looking up beauty, make-up, and fitness trends and ways to stay preoccupied.
Looking at the Auto niche, we can see a major spike in October 2021. Though not nearly as dramatic, Computers/Electronics also saw a big hike in EPMV. While there is still a microchip shortage, it was an especially hot topic in 2021. This caused ad rates, and thus EPMV, for these niches to see big, positive changes, as both computers and electronics were trending. If you look up ‘microchip shortage,’ ‘chip shortage,’ or ‘computer chip shortage’ in Google Trends for the end of October 2021, you will see that the ‘interest over time’ rate around October 15th, 16th, 25th, and 26th have peaks.
Ad spend in 2022
As aforementioned, ad rates are not following typical patterns as in previous years. 2020 and 2021 disrupted the ad space and 2022 is feeling the aftermath. In the coronavirus blog, we noted that the Ad Revenue Index, an ongoing chart that shows relative online ad rates by the day, typically follows the stock market. If you look at the NASDAQ, which is tech-heavy, it has continually been in decline this year.
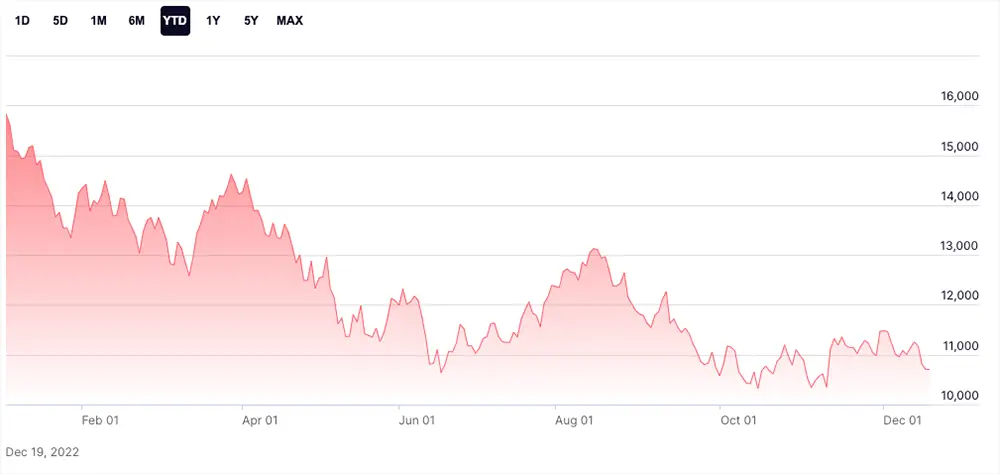
Looking at the Ad Revenue Index for the US through the pandemic, we can see the dip at the end of March 2020 when COVID-19 hit the United States on a larger scale, but then climbed and dipped like past years. Then, in 2021, we had an unprecedented Q3, with high ad rates in July and then a major incline at Black Friday.
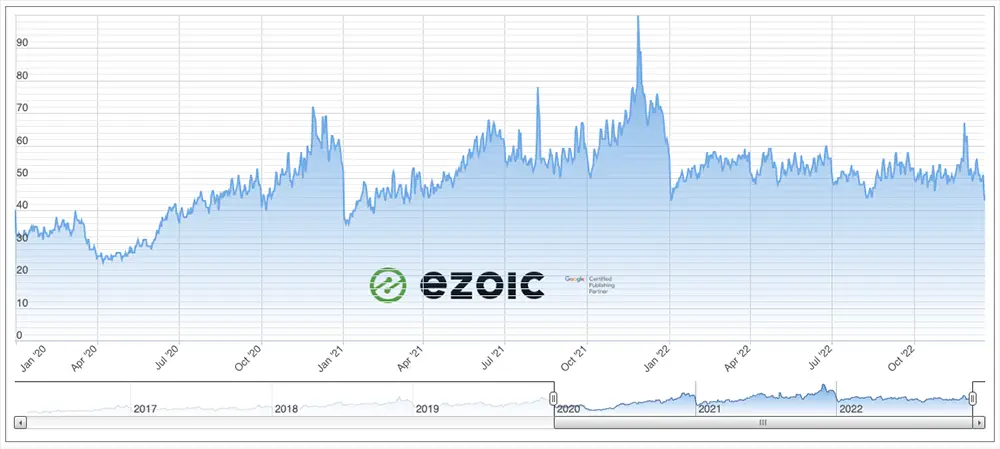
However, as you can see, ad rates have not recovered much since, and have stayed pretty stagnant all year, with only a slight spark on Black Friday.
Comparing the NASDAQ to the Ad Revenue Index, we can see both charts are showing rates unlike most years.
Why are ad rates down?
So why is ad spend down?
Firstly, as mentioned, the economy is down. If you followed along with our coronavirus blog, you know that one of the first things companies will do when money is tight is cut ad spending, especially digital ad spending. Digital advertising often does not require contracts, so it’s easy to simply cut back on ad spending. Big advertisers may still be spending a decent amount right now and be more likely to be in contracts, but most advertisers are smaller and can simply drop their advertising efforts.
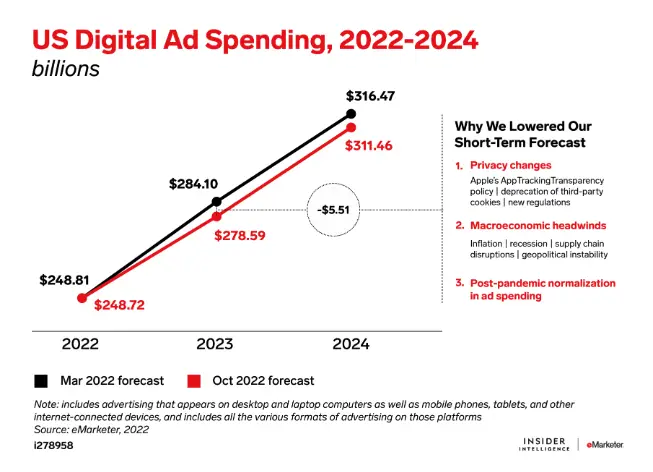
Additionally, if marketers put more effort into ads in the beginning of the year—looking at the Ad Revenue Index, we can see ad rates were pretty level until the start of Q3 in July 2022, where it then drops off for a month or so before stabilizing once more—they may not have had as much to spend the rest of the year as inflation rises and the economy gets worse.
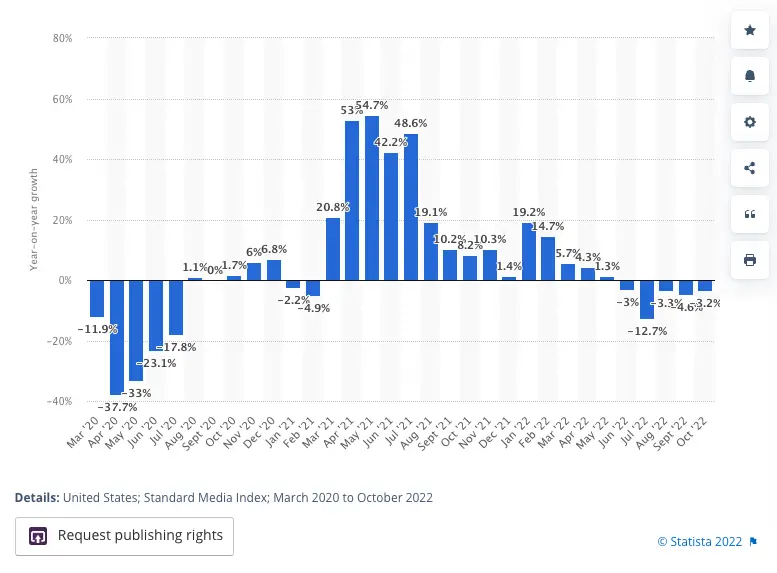
When the economy is down, it is major commodity-type companies that tend to hold the power in advertising, for example Coca-Cola. Even though there may be a recession on the horizon, people are not likely to cut back on their Coca-Cola intake as a result, but decrease their spending in other ways; therefore, Coca-Cola has no reason to decrease its ad spending. This makes it easy for these larger companies to throttle ad budgets and work it to their advantage, as there is less competition. Things that aren’t considered a commodity are the ones that cut their budgets down.
Not all major brands were safe in 2022, however. Major brands not considered a commodity all saw revenue fall at the end of Q3 and are still in recovery, such as media brands like Disney (-2%), Comcast (-5%), Paramount Global (-12%), Meta (-2%), and Google (-13%).
Ad spend and revenue in 2022
In general, ad rates are lower than expected for Q4, and definitely lower than anyone anticipated for 2022 when forecasting back before the pandemic.
There are certain categories and niches that did better in 2022 than during the pandemic and others that are seeing a decline as a recession seems more imminent.
In 2022, retail saw the highest ad spend, according to data by Statista, followed by CPG (Consumer Packaged Goods, i.e. food, makeup, household items, etc.), and financial services.
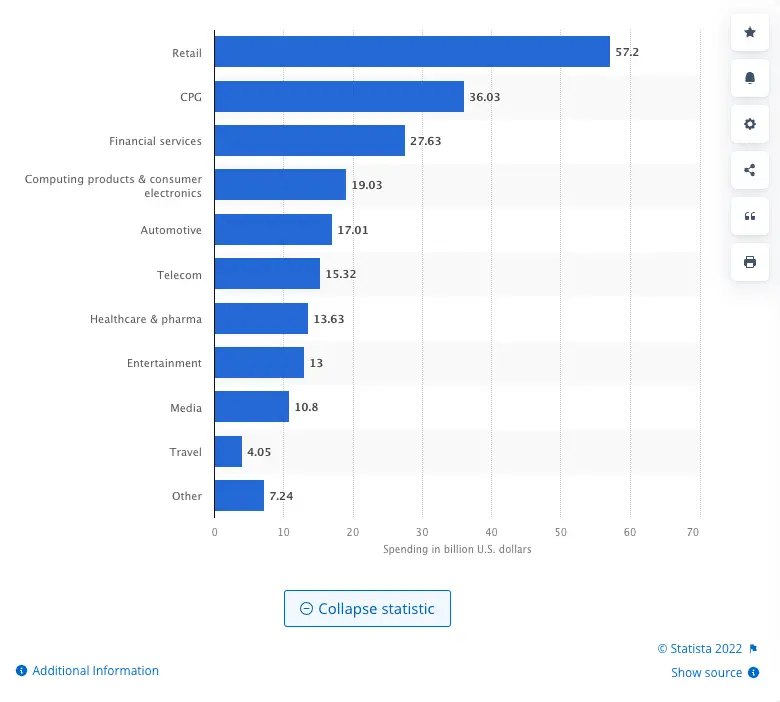
Retail was the category that saw the most ad spending growth in 2022, followed by travel and telecom, as shown by an eMarketer report.
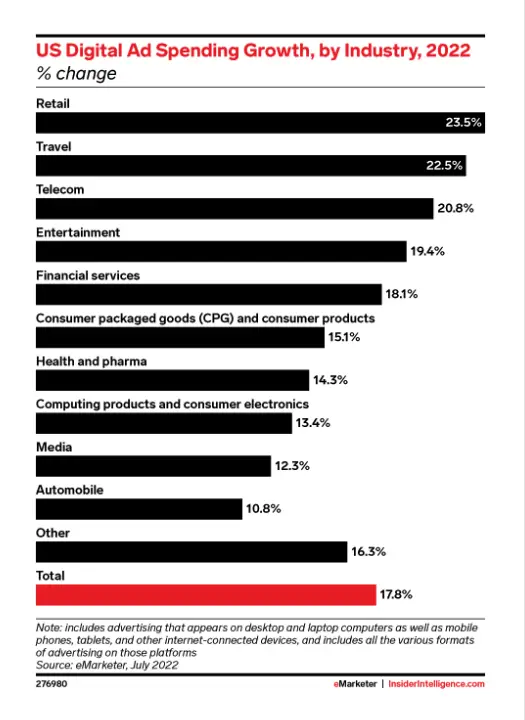
As a lot of these categories seen above were the most volatile at the start of the pandemic, it makes sense that their growth is substantial.
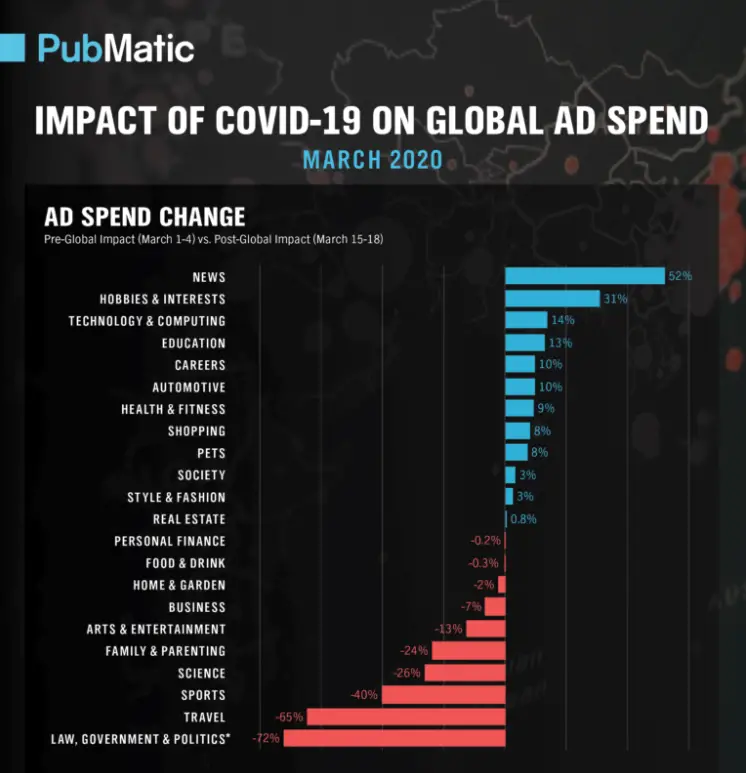
As for categories that haven’t faired as well this year, information from a Q2 report by MediaRadar shows that Finance, Home Furniture, Restaurants/Bars, Alcohol, and Pet Supplies have seen decreases in ad spend.
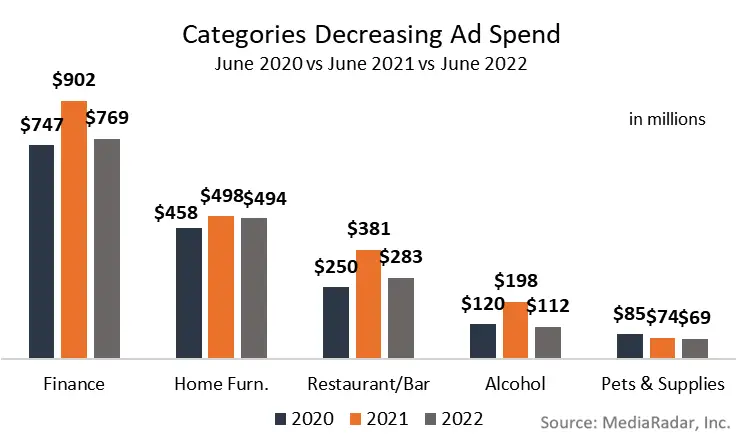
Finance and Real Estate saw the biggest hits this year. In 2021, a lot of ad money was spent on these groups because, during the pandemic, many people were buying homes and making important financial decisions as belts had to remain tight. Home furniture is also down because many people had to furnish these homes or buy work-from-home furniture; now that this wave has passed, advertisers are spending less money.
Restaurants and bars also decreased in ad spend this year. It is likely that as these institutions opened back up more regularly in 2021 after being closed or limited in 2020, they spent a lot more on advertising to encourage people to come in. Now that most everything is back to normal, restaurants and bars need to advertise less and have pulled back.
Many websites were also hit with one of many Google updates in September of this year, which may be affecting their ad revenue for Q4, as these sites might not be ranking as well as earlier in the year. According to data from SEMrush, the industries that saw the most rank volatility during the update are Communities, Hobbies & Leisure, Pets & Animals, Beauty & Fitness, and Games.
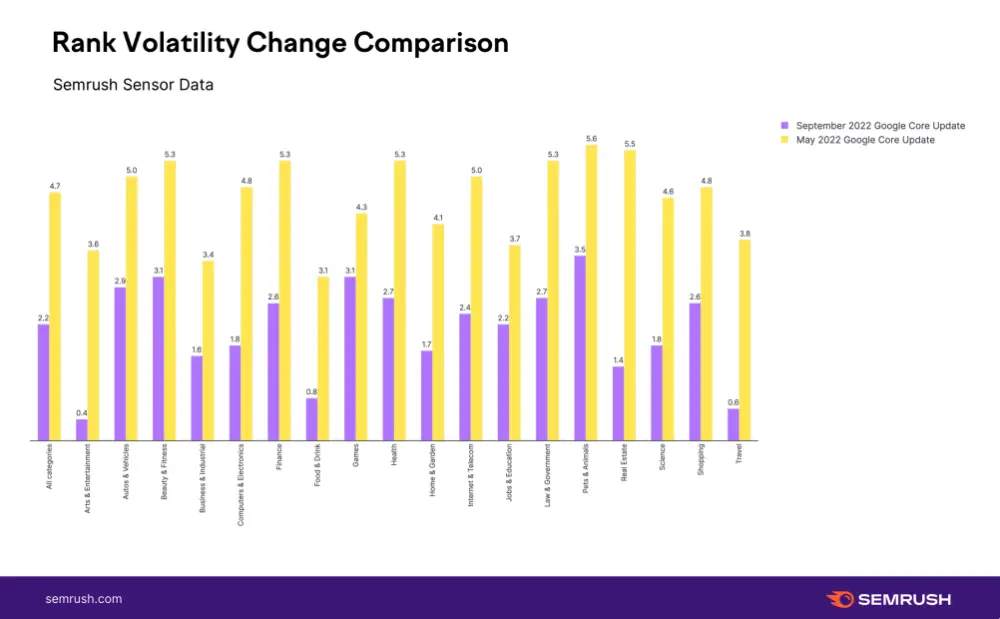
Websites that cover these topics may have noticed ranking, traffic, and ad revenue are down for them.
What can I do to improve my ad revenue?
If you’re looking for some advice on how you can make it through this tumultuous time in ad rates, there are a few things we can take from the pandemic that can be of service in surviving or even thriving during this period.
Quality over quantity ad inventory
It is important at this moment to keep your ad inventory stocked with quality advertisers and not just plug any advertiser that will give you money into your inventory. This includes avoiding something called malvertisers, or malware advertisers. They are likely to take advantage of publishers more in times of need than when ad rates are high. If you are dealing with malvertisers and aren’t getting paid, this article from clean.io discusses malvertising and how to protect yourself.
Ezoic is a great tool for publishers to keep their ad inventory full of quality advertisers. We have relationships with thousands of advertisers, all of which are vetted. By linking your site to Ezoic, you have access to all of your current advertising partnerships and all of Ezoic’s advertising partners. Furthermore, using an ads.txt file helps ensure that your digital ad inventory is only from authorized sellers.
Dynamic over static ad placements
Testing ad placement and performance is vital to earning the most money you possibly can during this time. Static ad placements, even if they are typically high-earning, can only get you so far, because they serve the same ad experience to everyone. Even if 80% of users react well to the ad experience, that is still leaving 20% of people dissatisfied that you could have earned revenue from.
By using dynamic ad placements through testing, like what Ezoic provides, you are guaranteed to earn the most from your ads because it is always accommodating for the ad and user experience based on visitor behavior and look-alike qualities. Through testing, the right ad size, placement, color, etc. are determined for each user based on previous results, constantly becoming more accurate to earn you the most money while also considering user experience.
Content is still King
Quality content still rules all. Don’t get so caught up on configuring your ads or designing your website that you slack off on your content. High-quality content is more likely to be consumed than content that isn’t unique or well-constructed.
Also, consider how you can use current trends in content that are earning high EPMV to your benefit. Retail and travel are popular right now. Are you a camping website? Write an article on the best places to travel for camping in the winter and spring. Do you have a finance website? Think about retail trends related to money, like the growing popularity in paying in installments rather than all at once and what this might mean for consumers.
Video is growing quickly
According to a report by Cisco, video now makes up over 82% of all internet traffic. Additionally, a Channel Factory report discovered that 41% of Gen Zers use video to boost their mood and a Think with Google piece found that half of Gen Zers and Millennials “don’t know how to get through life without video.”
Are you prepared for the continuing growth of video? Adding video to your content not only engages users more but benefits SEO, as you’re more likely to rank higher with video content on your landing pages. If you’re not comfortable being on camera, products like Humix allow you to use other publishers’ videos on your site and earn you revenue immediately—unlike other major video platforms, no wait time is necessary. Or, if you’re a video creator, you can allow your videos to be shared across the Humix network for other publishers to use, and you get a cut of the revenue.
In addition to Humix is Flickify, which can easily be used in conjunction with Humix. Plugging your content into Flickify allows the tool to ‘read’ your content and it quickly creates a video that can be added to your website. You can customize the video as much or as little as you want, and then easily upload it to the Humix network to be used on your website or shared with other publishers to use.
For ideas on how to boost your revenue with video, check out our blog.
What will be 2023 digital publishing trends?
Digital publishing is changing faster than ever, and it’s important to remain informed and agile.
We hope this has begun to paint a picture for you of what has been happening in digital publishing recently and the historical context behind it. We will be continuing to update this article with publishing trends and news, ad rate changes, and predictions for 2023. Stay tuned for the next update after the new year.
Happy Holidays and have a great New Year! See you in 2023.
